
For a chemical compound that shows up nearly everywhere on the planet, methane still surprises us. It is one of the most potent greenhouse gases, and yet the reasons for why and where it shows up are often a mystery. What we know for sure is that a lot more methane (CH4) has made its way into the atmosphere since the beginning of the Industrial Revolution. Less understood is why the ebb and flow of this gas has changed in recent decades.
You can find the odorless, transparent gas miles below Earth’s surface and miles above it. Methane bubbles up from swamps and rivers, belches from volcanoes, rises from wildfires, and seeps from the guts of cows and termites (where is it made by microbes). Human settlements are awash with the gas. Methane leaks silently from natural gas and oil wells and pipelines, as well as coal mines. It stews in landfills, sewage treatment plants, and rice paddies.
The Atmospheric Infrared Sounder (AIRS) aboard NASA’s Aqua satellite offers one satellite-based perspective on the methane in Earth’s atmosphere. The map above shows global methane concentrations in January 2016 at a pressure of 400 hectopascals, or roughly 6 kilometers (4 miles) above the surface. Methane concentrations are higher in the northern hemisphere because both natural- and human-caused sources of methane are more abundant there. Since AIRS observed the methane fairly high in the atmosphere, winds may have transported plumes of gas considerable distances from their sources.

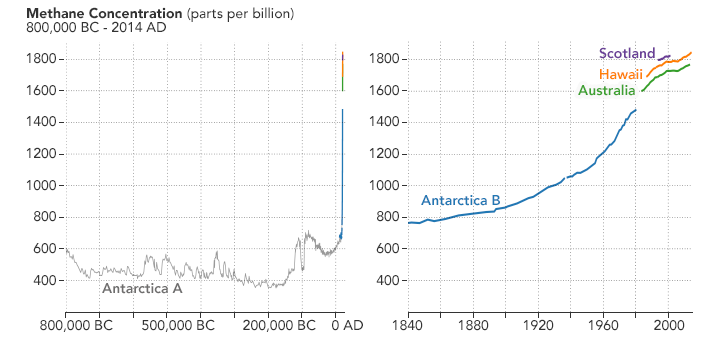
The long-term, global trend for atmospheric methane is clear. The concentration of the gas was relatively steady for hundreds of thousands of years, but then started to increase rapidly around 1750. The reason is simple: increasing human populations since the start of the Industrial Revolution have meant more agriculture, more waste, and more fossil fuel production. Over the same period, emissions from natural sources have stayed about the same. The charts above, based on a combination of historical ice core data and air monitoring instrument data, depict the rate of increase.
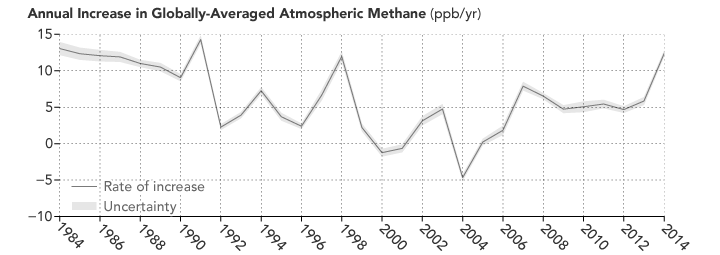
But if you focus on just the past five decades—when modern scientific tools have been available to detect atmospheric methane—there have been fluctuations in methane levels that are harder to explain. The chart below, based on data collected by the National Oceanic and Atmospheric Administration, shows variations in the rate of increase in the concentration of methane in the atmosphere between 1984 and 2014.

In 1985, the average concentration was 1,620 parts per billion (ppb). By 2015, it had increased to 1,800 ppb. (Before the Industrial Revolution, concentrations held steady at about 700 ppb.) But the rate of increase in recent decades has varied. From the 1980s until 1992, methane was rising about 12 ppb per year. Then came roughly a decade of slower growth at 3 ppb per year. Between 2000 and 2007, atmospheric methane concentrations stabilized. Starting in 2007, they began to rise again and have continued to do so since, increasing at a rate of 6 ppb per year.
Since 2007, methane has been on the rise, and no one is quite sure why. Some scientists think tropical wetlands have gotten a bit wetter and are releasing more gas. Others point to the natural gas fracking boom in North America and its sometimes leaky infrastructure. Others wonder if changes in agriculture may be playing a role. “There is no question that methane is doing some very odd and worrying things,” said Euan Nisbet, an atmospheric scientist at Royal Holloway, University of London. The big question is why. Scientists wonder if they will have the right monitoring systems in place to answer that question adequately.
Read more in our new feature Methane Matters.
NASA Earth Observatory images by Joshua Stevens, using data from the Atmospheric Infrared Sounder (AIRS) team, the Environmental Protection Agency, and NOAA. Caption by Adam Voiland.