

California just finished one of its driest years on record and is now in its fourth year of drought. The effects have been reflected by the landscape in many ways, from exposed lake bottoms to snowless mountains. The effect is uneven and complicated, however, when you look at the vegetation in this fertile, agriculturally rich state.
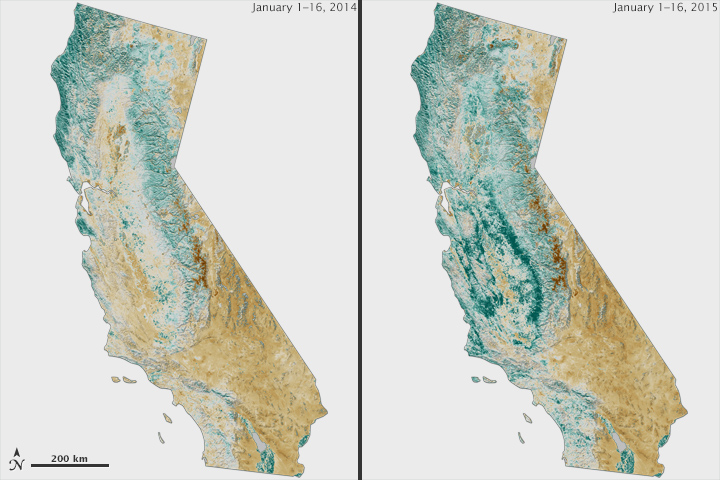
The maps above show the enhanced vegetation index (EVI) for California for early January 2014 (left) and January 2015 (right). EVI is a satellite data product that describes the “greenness” of the landscape. The product quantifies the amount of sunlight absorbed and reflected by the chlorophyll in vegetation—a proxy measurement of the health of trees, shrubs, crops, and grasses. Greenness generally increases with plant canopy growth and decreases with droughts, frosts, seasonal changes, or other events that cause leaves to die and change color. The data for the maps above were collected by the Visible Infrared Imaging Radiometer Suite (VIIRS) on the NASA/NOAA Suomi NPP satellite.
“The January 2014 map is extremely anomalous and is an indicator of the nature of this historic drought in one picture,” said Jennifer Dungan, a remote sensing specialist at NASA’s Ames Research Center. “With the 2015 data, the story gets more complex. There is green-up from strong December storms, but that does not mean the drought is over.”
In January 2014, the majority of California had below-normal levels of vegetation greenness (as measured by EVI), though the farm-filled Central Valley was neither positive nor negative because many fields are typically bare and between plantings in January. In both years, the Sierra Nevada and other mountain ranges are unusually brown, a reflection of the lack of rain and snow.
In January 2015, more of the state has greened, an immediate reflection of several heavy rain events in December 2014. The effect will not be lasting, though, unless the state receives more of the rain and snow that typically moisten the region each winter.
“We took a close look at the early January data because it is the time of year when California’s ‘natural’ vegetation is normally green, reflecting the response of the vegetation to autumn rains,” Dungan said, referring to the native vegetation as opposed to irrigated farmlands, ranches, vineyards, and orchards. “The main green-up in 2015 is on the edges of the Central Valley, primarily the foothills of the Sierra and Diablo ranges.”
In the 2014 water year (October 1, 2013, to September 30, 2014), many Central Valley farmers received 10 percent or less of their full surface water allocations from the California State Water Project and the Central Valley Project. This led to extensive pumping of groundwater for use in irrigation. So while hundreds of thousands of acres of farmland have been idled by the drought, many still appear active and green while the rest of the landscape gets parched.
January usually arrives with the most precipitation in an average year, but many parts of California just had the driest January on record. And despite the December rains, the state has seen just 47 percent of its usual precipitation four months into the water year. So unless rain picks back up, the EVI maps will likely grow brown again this spring.
NASA Earth Observatory images by Jesse Allen, using VIIRS EVI data from the Suomi National Polar-orbiting Partnership and provided by Jennifer Dungan (NASA/Ames). Suomi NPP is the result of a partnership between NASA, the National Oceanic and Atmospheric Administration, and the Department of Defense. Caption by Mike Carlowicz.