The Earth Observatory has published its last Image of the Day on this website. Please join us on our new home at science.nasa.gov/earth/earth-observatory.
Almost any discussion of global warming begins or ends with carbon dioxide. Because of its molecular structure, carbon dioxide is a greenhouse gas, which means it allows visible light from the Sun to pass through the atmosphere while absorbing and reemitting infrared energy, heating the Earth. Greenhouse gases act as insulation and are responsible for making Earth’s climate comfortable—without them, our planet would have an average temperature of -18 Celsius (0 Fahrenheit). Since the beginning of the Industrial Revolution, people have been releasing carbon dioxide into the atmosphere by burning fossil fuels and clearing forests. By adding extra greenhouse gases to the atmosphere, people are raising the planet’s temperature with wide-ranging impacts.
Carbon dioxide is neither the most potent, nor the most abundant greenhouse gas, but it is the one most responsible for altering global temperatures. This close connection between climate and carbon is a compelling reason to keep track of carbon dioxide concentrations in the atmosphere. The first space-based instrument to independently measure atmospheric carbon dioxide day and night, and under both clear and cloudy conditions over the entire globe, is the Atmospheric Infrared Sounder (AIRS) on NASA’s Aqua satellite.
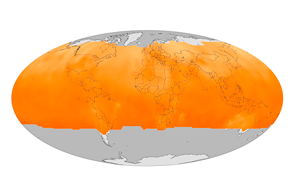
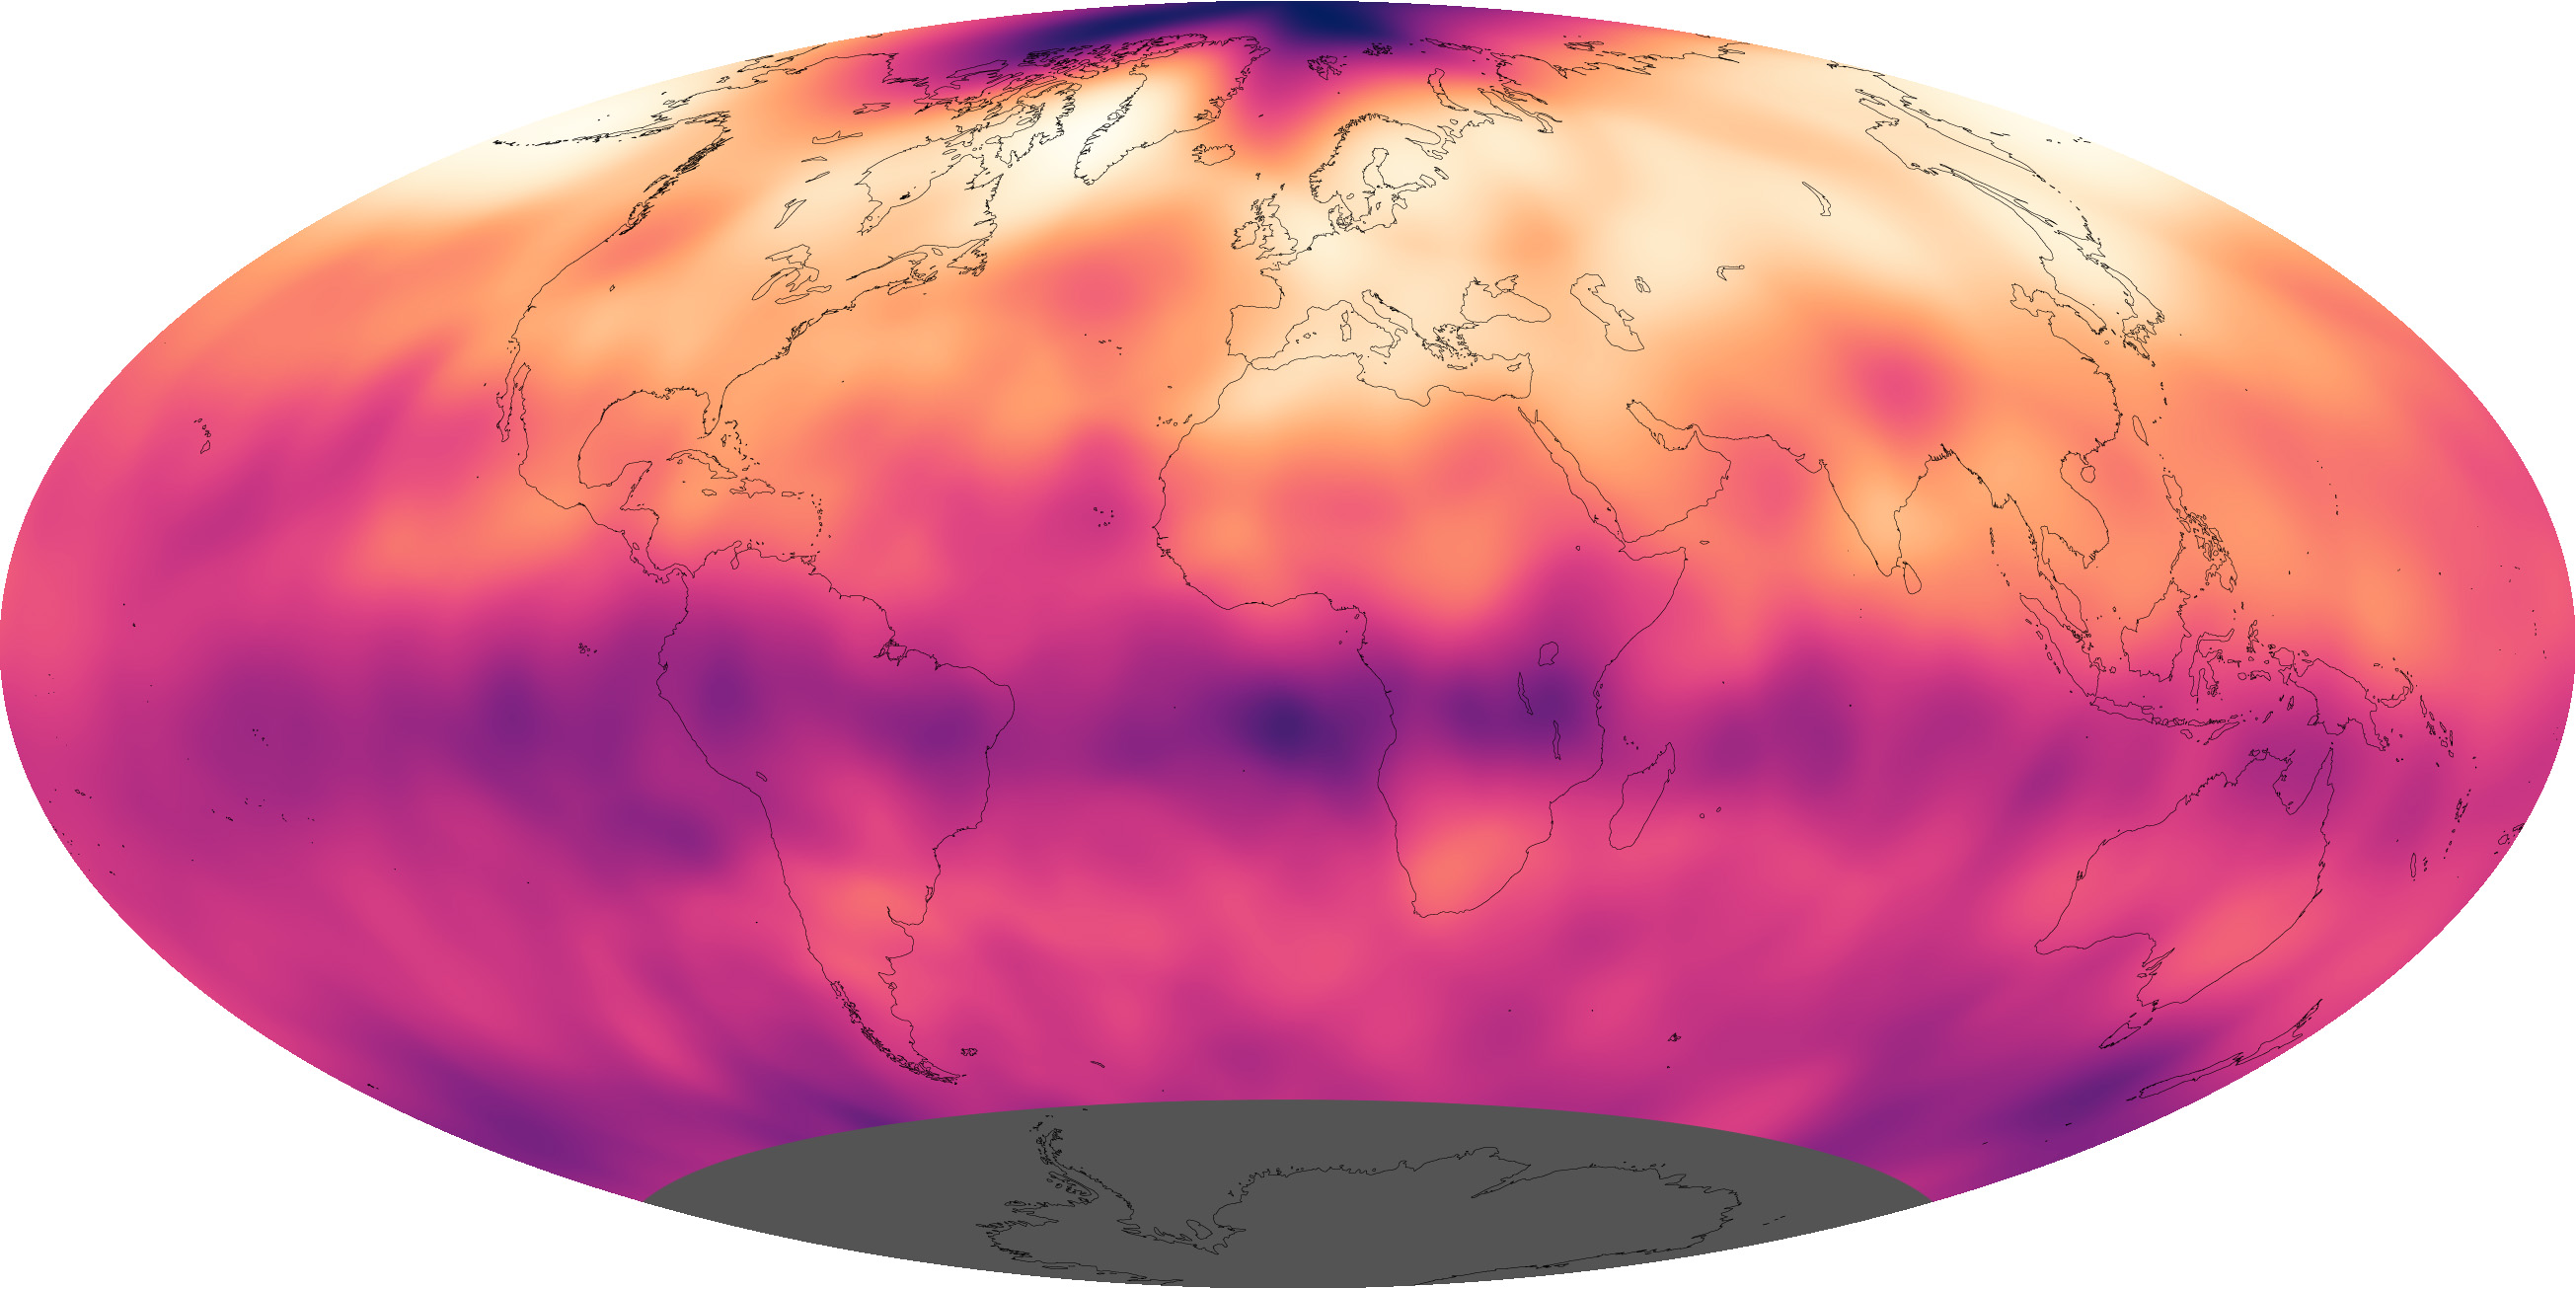
The map above shows carbon dioxide in the mid-troposphere, the part of the atmosphere where most weather occurs. The data was collected in May 2013, when carbon dioxide levels reached their highest point in at least 800,000 years. The highest concentrations, shown in yellow, are in the Northern Hemisphere. Concentrations are lower in the Southern Hemisphere. In May, the Northern Hemisphere growing season was just beginning, so plants were removing little carbon from the atmosphere.
The AIRS instrument measures 2,378 different infrared channels, or segments, of infrared light. Carbon dioxide absorbs and emits very specific wavelengths of infrared light, giving it a unique fingerprint. By measuring the emitted thermal infrared radiation, AIRS can detect this fingerprint, giving scientists a way to estimate carbon dioxide concentrations globally.
AIRS has shown that carbon dioxide is not evenly distributed over the globe; it is patchy with high concentrations in some places and lower concentrations in others. The gas’s transport and distribution through the atmosphere is controlled by the jet stream, by large weather systems, and by other large-scale atmospheric circulations. The findings from AIRS have raised new questions about how carbon dioxide is transported from one place to another—both horizontally and vertically—through the atmosphere. To address these questions and others, NASA is preparing to launch the Orbiting Carbon Observatory in 2014. It will be the first satellite dedicated to monitoring carbon dioxide, and it will do so with greater precision and detail than current instruments.
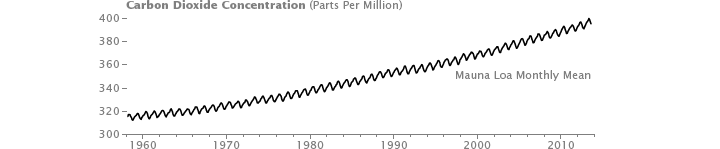
Much of what we now know about atmospheric carbon dioxide concentrations comes from a monitoring station in Mauna Loa, Hawaii, started by Charles David Keeling in 1958. The graph below shows measurements from that ground station, which peaked in May 2013 at 399.76 parts per million. At the beginning of the Industrial Revolution, carbon dioxide levels in the atmosphere were roughly 278 parts per million.
The impact of rising carbon dioxide concentrations—including warmer global temperatures, altered weather patterns, changes in ecosystems, and melting ice—are summarized in the new Fifth Assessment Report from the Intergovernmental Panel on Climate Change (IPCC), which will be released on September 30, 2013. The report’s summary for policy makers will be presented in a webcast on September 27. The last summary assessment report was released in 2007.
NASA Earth Observatory image by Rob Simmon and Jesse Allen with data courtesy the AIRS science team. Mauna Loa data courtesy NOAA Earth System Research Laboratory. Caption by Holli Riebeek.