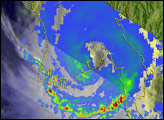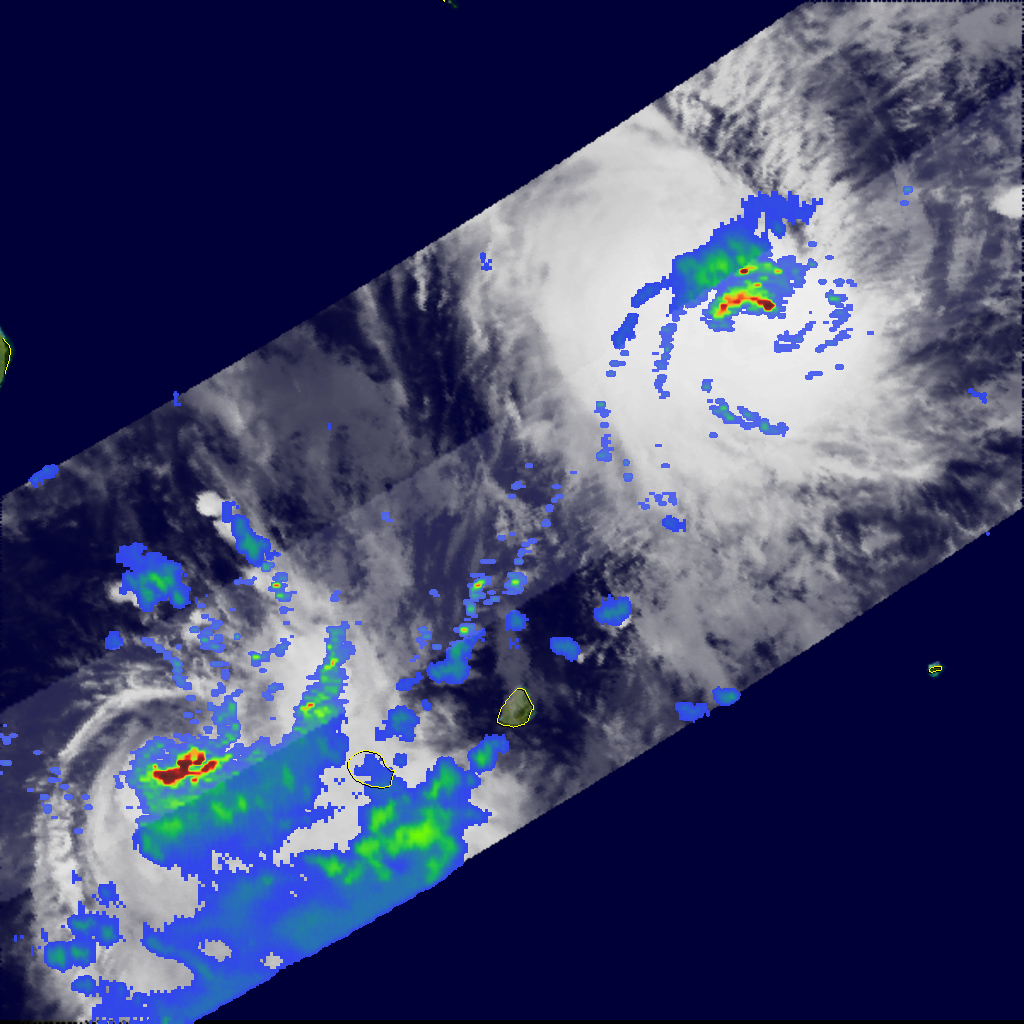
This image shows two cyclones in the Indian Ocean: Fame and Gula. Fame crossed Madagascar on January 25, 2008. It formed in the Mozambique Channel and then traveled eastwards over the island and back into the Indian Ocean, where it reformed. Gula was a cyclone that formed east of Madagascar two days later and headed south. Both cyclones skirted, but never crossed, the islands of Mauritius and Reunion.
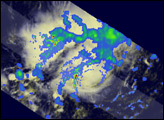
This image, based on data collected by the Tropical Rainfall Measuring Mission (TRMM) satellite on January 29, 2008, at 6:53 p.m. local time (14:53 UTC), shows rainfall rates in the two storms. Cyclone Gula is in the upper right corner of the image, and at the time these data were obtained, it was a Category 1 storm, with maximum sustained winds estimated at 80 knots (147 kilometers per hour; 92 miles per hour) by the Joint Typhoon Warning Center. It reached a peak intensity of 85 knots after this image was taken. Fame, in the lower left corner, was a much weaker tropical storm, with maximum sustained winds estimated at 35 knots (65 km/hr; 40 mph). Neither system had a defined eye, nor were they very well organized.
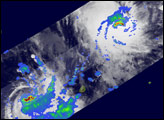
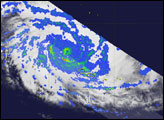
When the circulations of two cyclones come into close proximity to each other, they can interact. One of these possible interactions is known as the Fujiwara effect wherein the cyclones begin to circle around one another and are drawn closer together. The stronger circulation can impede or dominate the weaker one. The stronger storm may even absorb the weaker storm. In TRMM data collected two days later, it appeared the two storms had at least briefly orbited each other as they both weakened, suggesting a Fujiwara-type interaction. However, the storms remained separated.
The TRMM satellite was placed into service in November 1997. From its low-earth orbit, TRMM provides valuable images and information on storm systems around the tropics using a combination of passive microwave and active radar sensors, including the first precipitation radar in space. In this image, rain rates in the center of the swath are from the TRMM Precipitation Radar, and those in the outer swath come from the TRMM Microwave Imager. The rain rates are overlaid on infrared data from the TRMM Visible Infrared Scanner. TRMM is a joint mission between NASA and the Japanese space agency, JAXA.
NASA image created by Hal Pierce. Caption by Steve Lang and Jesse Allen.