The Earth Observatory has published its last Image of the Day on this website. Please join us on our new home at science.nasa.gov/earth/earth-observatory.
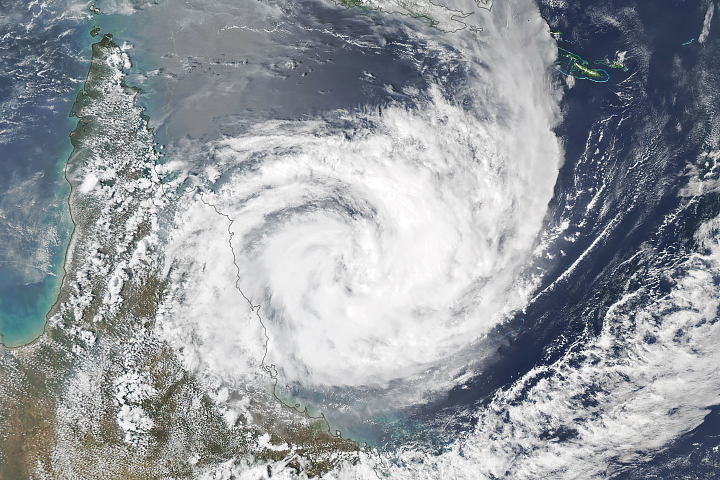
Starting in late January 2025, a slow-moving summer storm dropped copious rain along the northeastern coast of Queensland, Australia. A week later, rainfall totals totaled more than 100 centimeters (39 inches) in some areas, according to Australia’s Bureau of Meteorology (BoM).
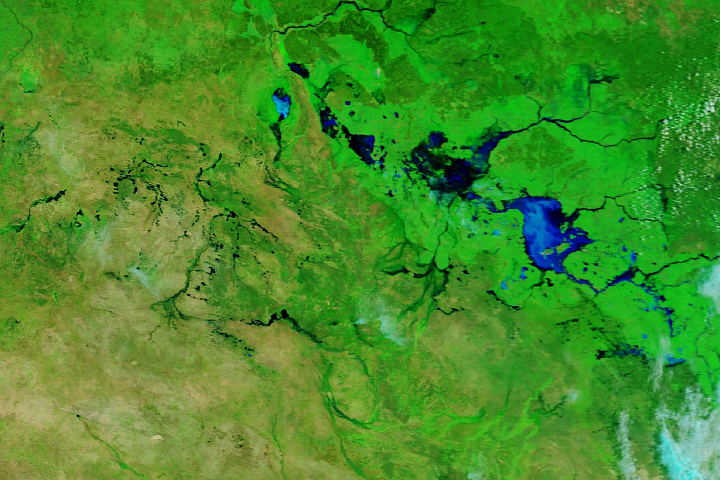
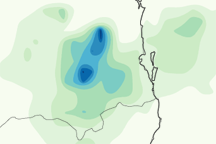
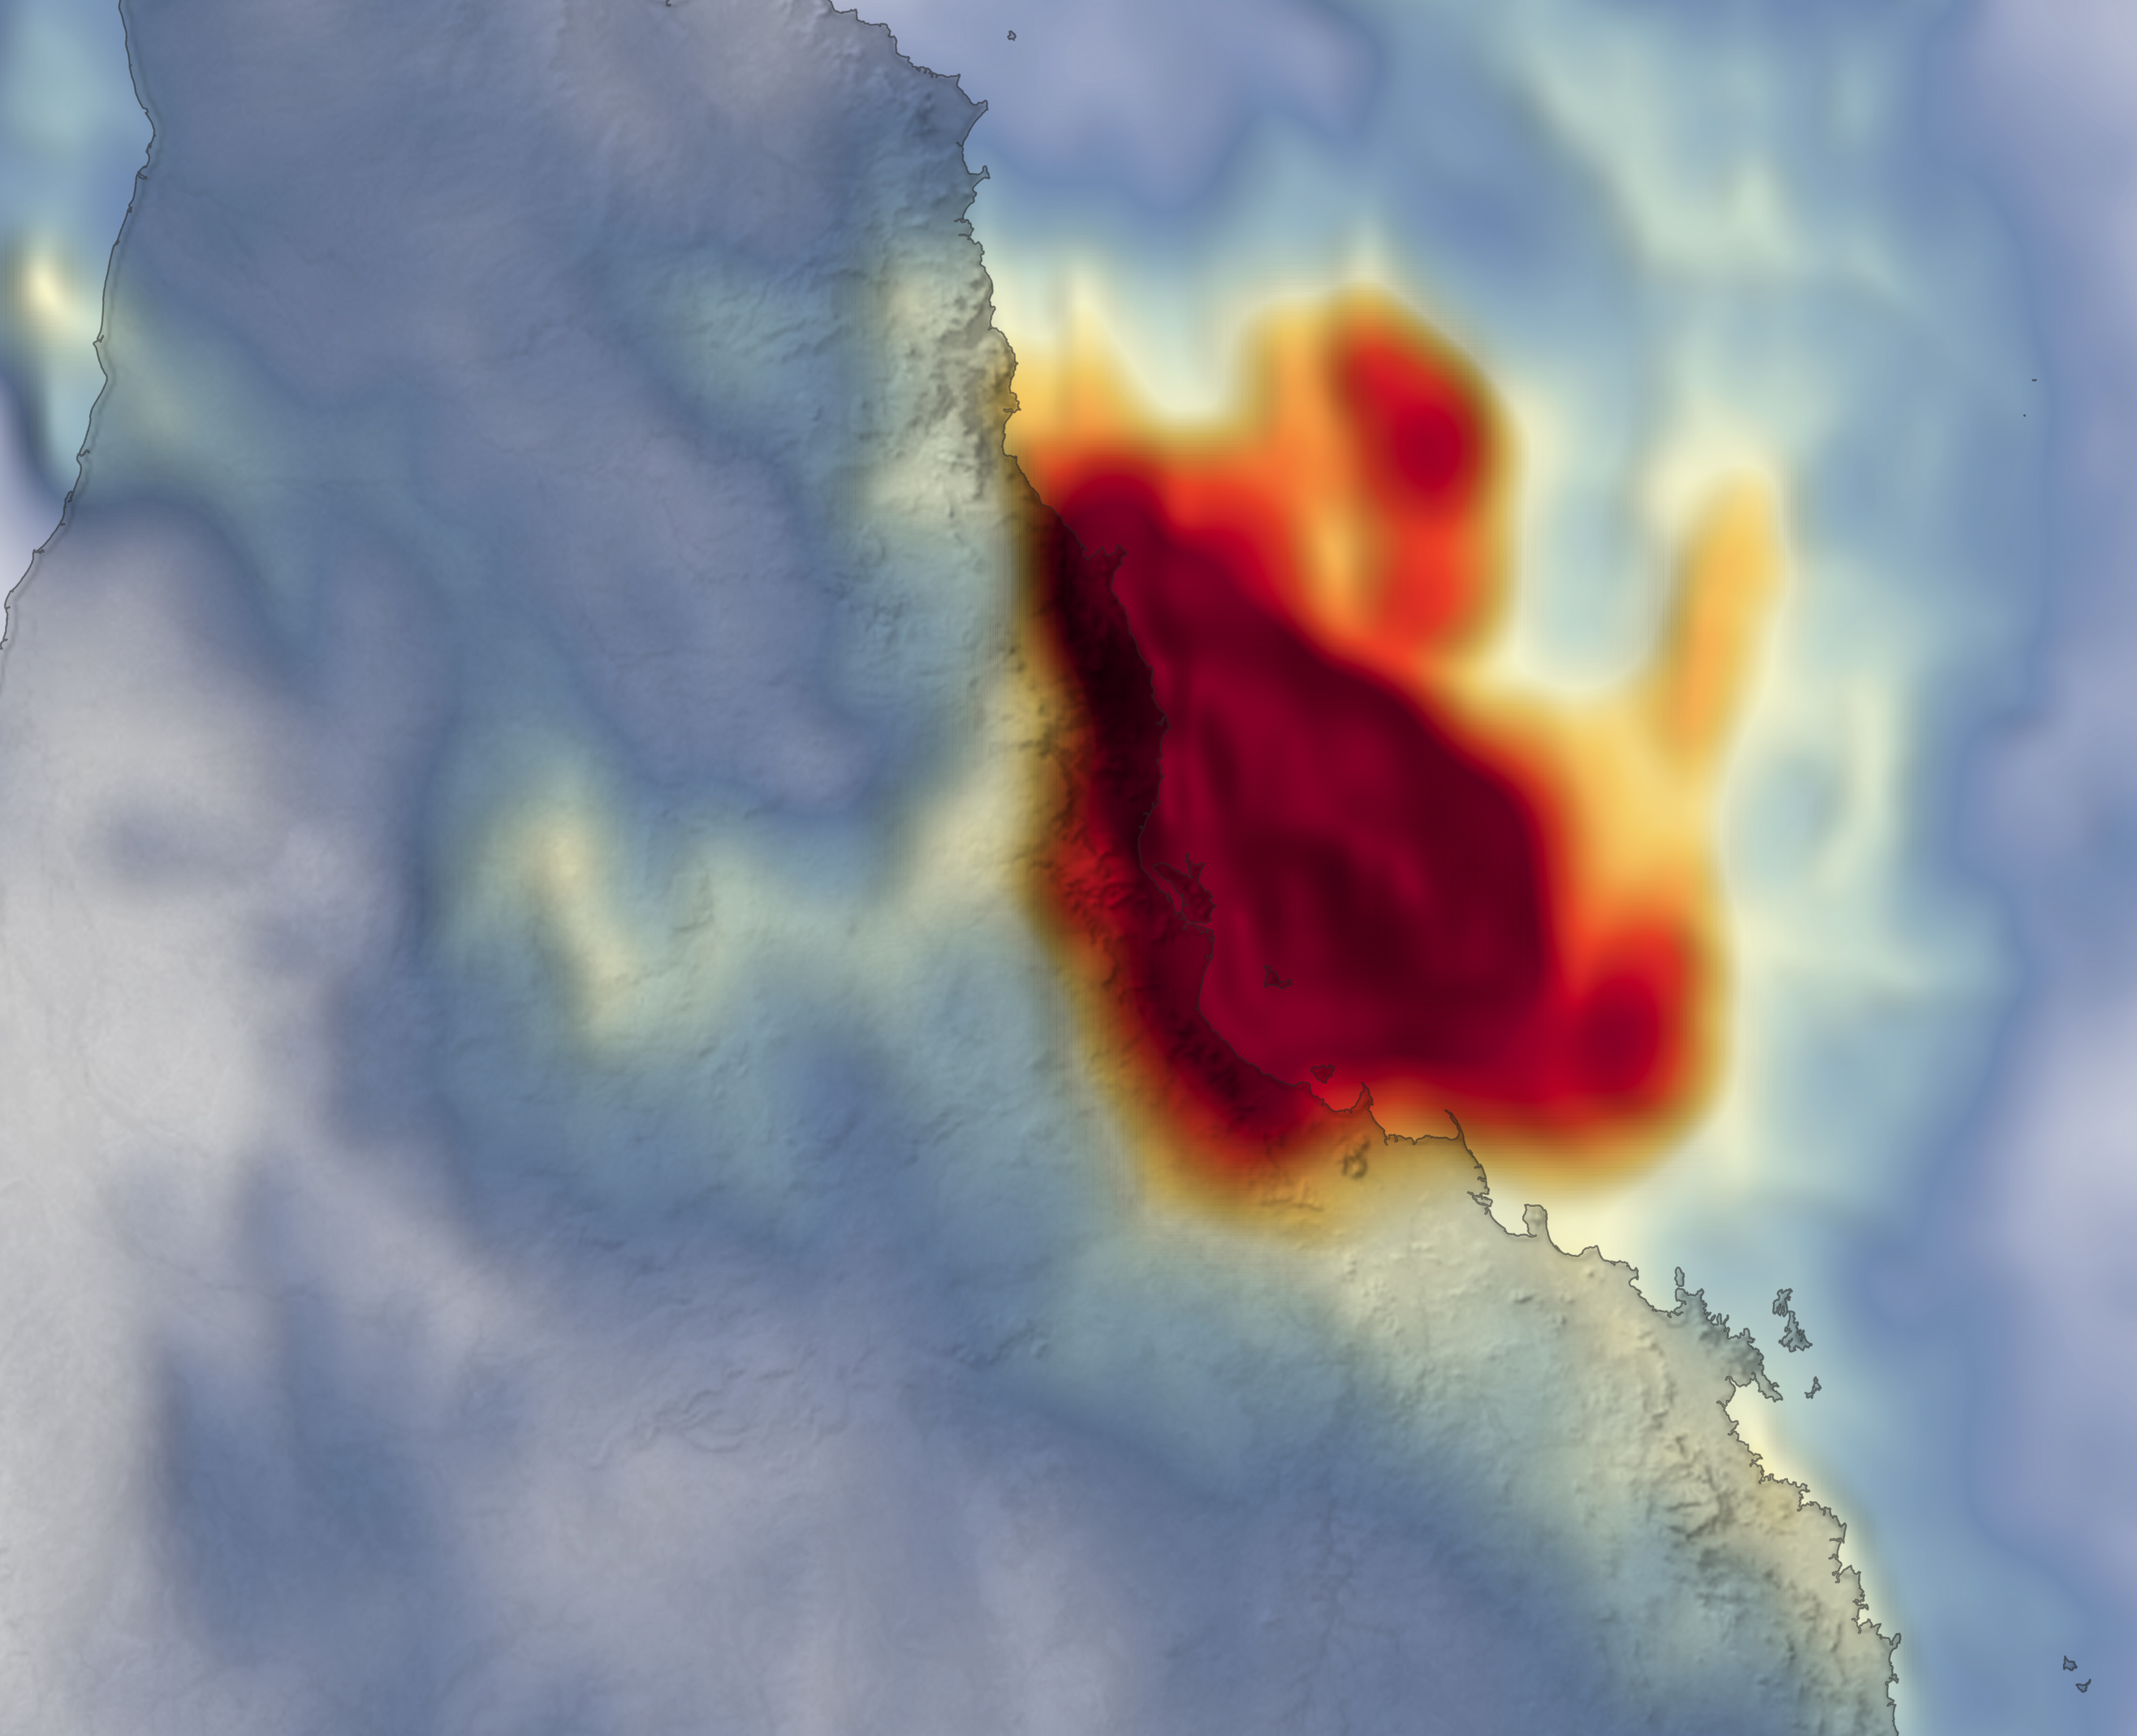
The rainfall was especially intense for several days along several hundred kilometers of the coast between Cairns and Ayr. The map above shows rainfall accumulation in a period of just over four days ending on February 4, 2025. The reddest areas are where rainfall totals during this period were the highest.
These data are remotely sensed estimates that come from IMERG (the Integrated Multi-Satellite Retrievals for GPM), a product of the GPM (Global Precipitation Measurement) mission, and may differ from ground-based measurements. For instance, IMERG data are averaged across each pixel, meaning that rain-gauge measurements within a given pixel can be significantly higher or lower than the average.
Ground-based measurements indicate that the city of Townsville saw the equivalent of six months of rain in just three days, according to BoM Queensland. The largest weekly rainfall total was measured at a gauge in the Cardwell Range, southwest of Tully, where almost 170 centimeters (67 inches) fell.
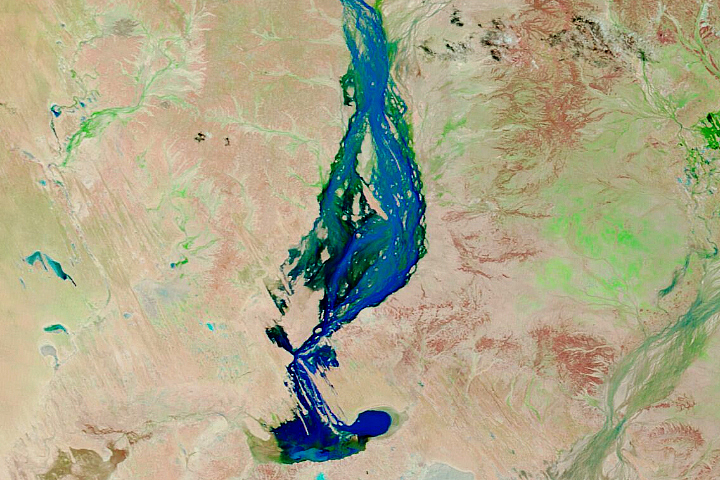
Thousands of people evacuated as flooding threatened the region, according to news reports. The deluge isolated some communities, caused rivers and reservoirs to spill over their banks, and destroyed parts of a main highway. As of the morning of February 6, a major flood warning persisted along the Herbert River, meaning large areas were inundated. Watches and warnings remained in effect for more than a dozen other rivers.
Tropical lows are common in northern Australia in February, during the region’s wet season. But this storm was especially slow and productive in terms of rain, with many areas breaking records for daily or multi-day totals.
NASA Earth Observatory image by Michala Garrison, using IMERG data from the Global Precipitation Mission (GPM) at NASA/GSFC. Story by Kathryn Hansen.