The Earth Observatory has published its last Image of the Day on this website. Please join us on our new home at science.nasa.gov/earth/earth-observatory.
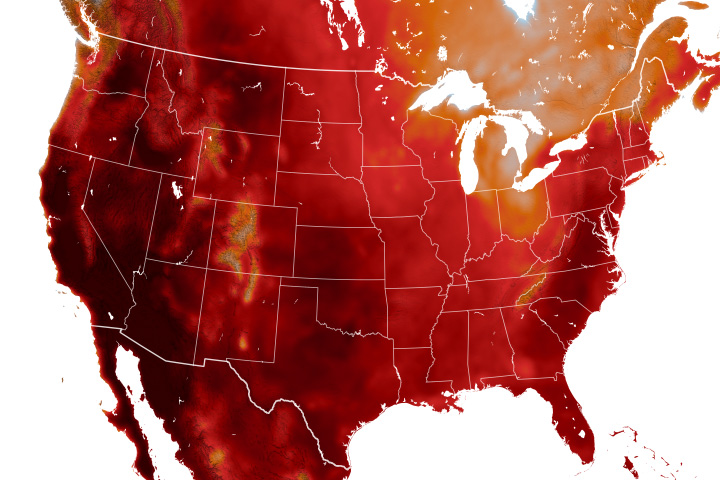
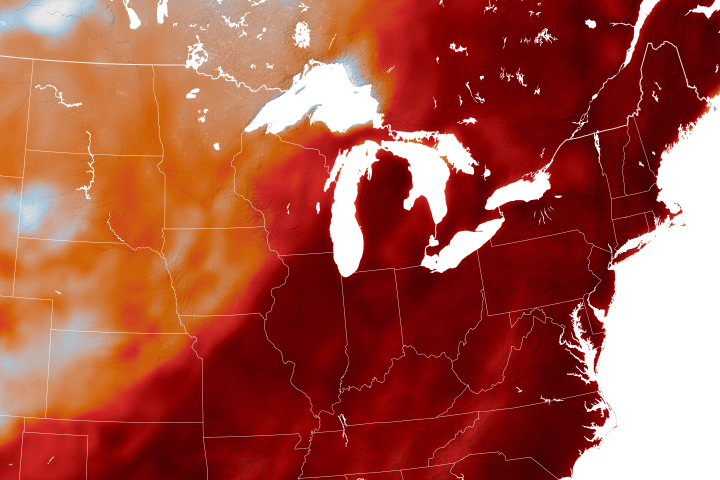
An area of high pressure lingered in the upper atmosphere over the U.S. Midwest and Northeast in June 2024. This pushed warm air toward the surface and trapped it there—a weather phenomenon meteorologists call a heat dome.
Heat domes put the brakes on convection and suppress clouds and precipitation. This allows sunlight to reach Earth’s surface relatively unhindered and further elevate air temperatures. As a result of the June heat dome, people in the Midwest and Northeast saw a string of days with sweltering temperatures that tied or broke calendar-day records in several states.
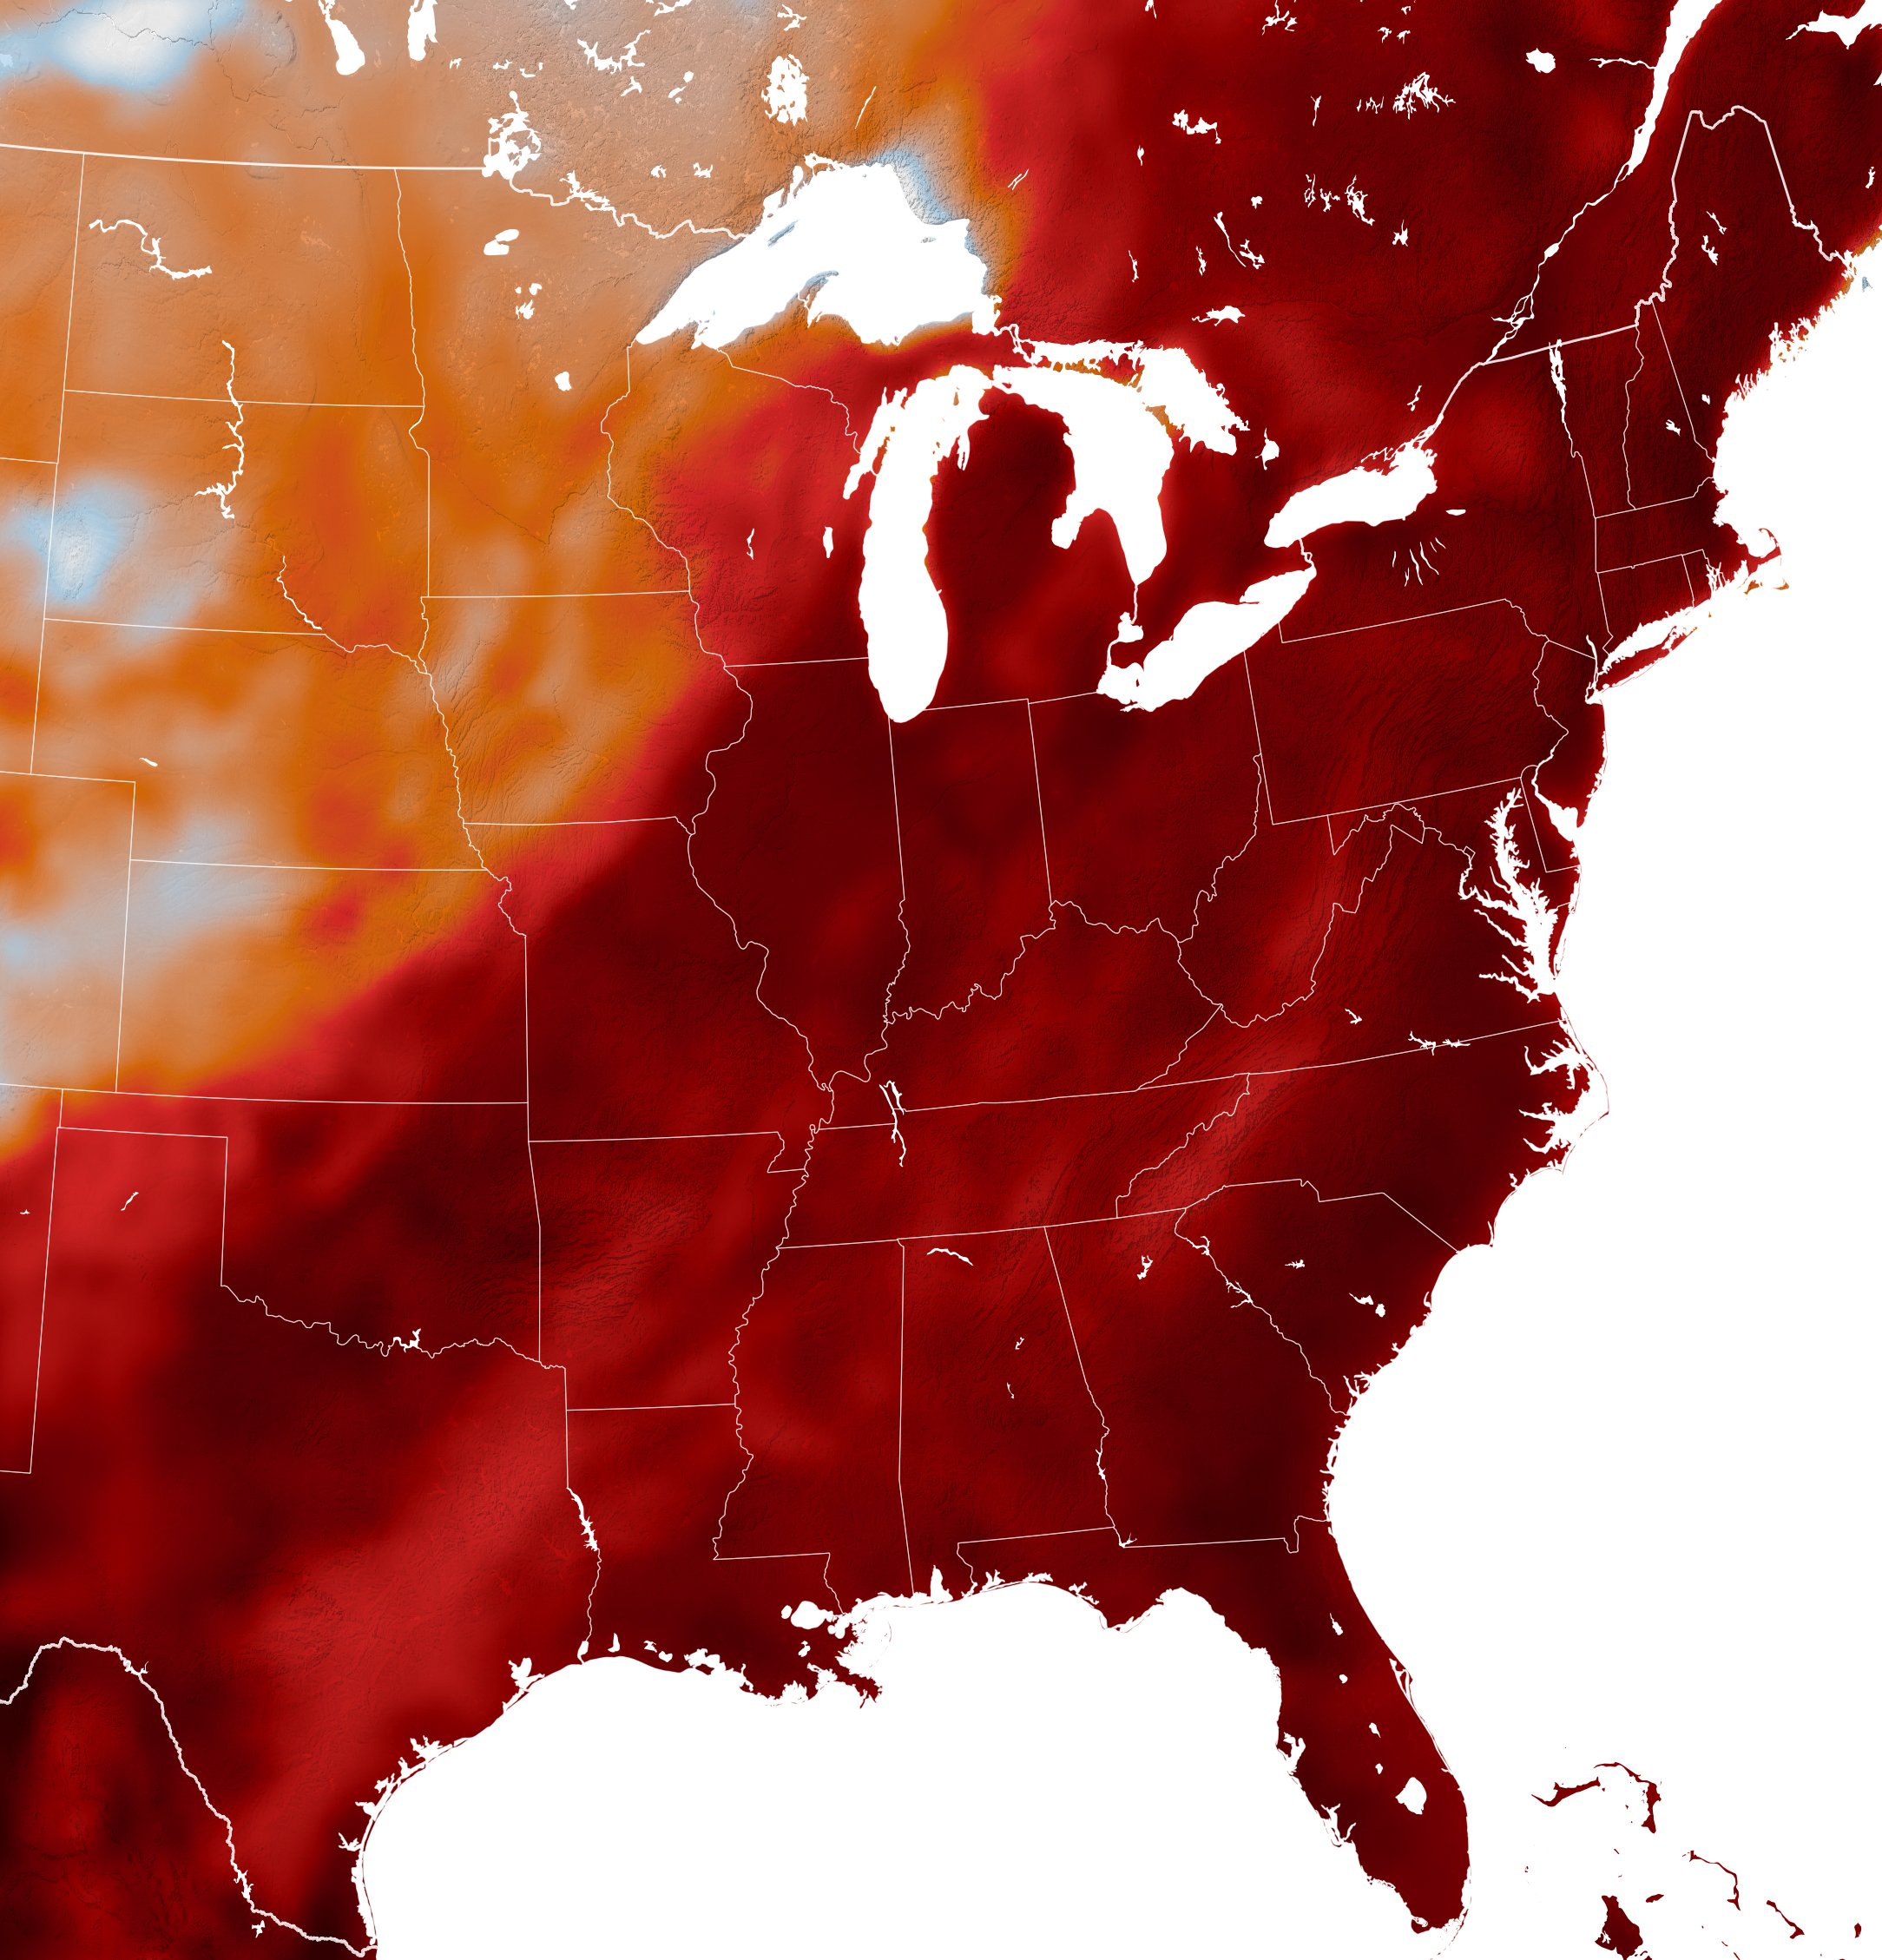
The map above shows air temperatures across the eastern U.S. on June 19, 2024. The map was produced by combining observations from satellites and other sources with temperatures predicted by a version of NASA’s GEOS (Goddard Earth Observing System) model, which uses mathematical equations to represent physical processes in the atmosphere. The darkest reds indicate temperatures of more than 93 degrees Fahrenheit (34 degrees Celsius) at about 6.5 feet (2 meters) above the ground.
Boston, Massachusetts, hit 98°F and Hartford, Connecticut, reached 97°F on June 19, breaking calendar-day records, according to the National Weather Service. Manchester, New Hampshire, and Scranton, Pennsylvania, broke calendar-day records the day before. And on June 17, Chicago, Illinois; Pittsburgh, Pennsylvania; Indianapolis, Indiana; Milwaukee, Wisconsin; Cleveland, Ohio; Syracuse, New York; Louisville, Kentucky; and Fort Lauderdale, Florida, all tied or broke records.
Extreme heat doesn’t just make people uncomfortable. It can have serious health consequences, particularly for older people. Health tracking data from the Center for Disease Control and Prevention shows that the rate of heat-related emergency department visits in the Midwest and Northeast spiked more than fourfold during the June heatwave.
“Extreme heat worsens common age-related health conditions such as heart, lung, and kidney disease and can cause delirium,” explained Deborah Carr, a Boston University sociologist who specializes in the study of aging.In a recent analysis, Carr used temperature and climate data archived by NASA and demographic data to identify regions that are at the greatest risk of current and future heat exposure. She found that the Northeast and Midwest regions, historically home to high shares of older adults, are projected to experience the steepest increases in heat exposure relative to temperatures historically experienced.
“Older adults who are accustomed to the New England chill may not fully understand the threats an extreme heat wave can pose, and they may underestimate the harm they might suffer from a day in the hot Sun,” she said, adding that older homes in these regions tend to have less efficient cooling systems and that nighttime heat can be particularly harmful for those without air conditioning.
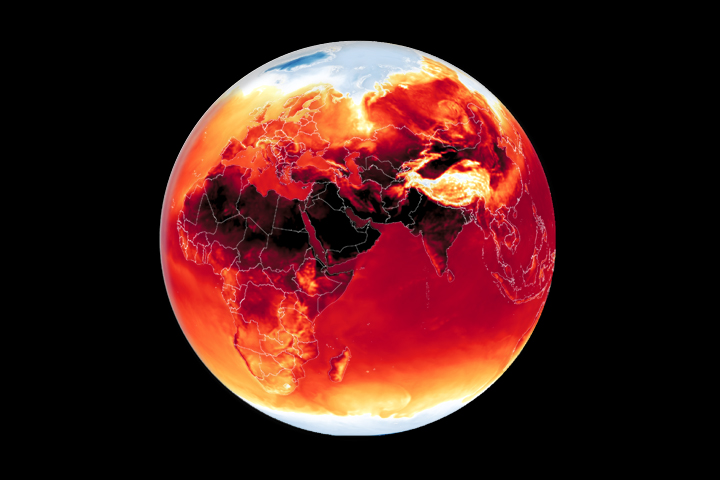
Heat waves like the June event have become more frequent in the United States in recent decades, according to researchers at NASA’s Goddard Space Flight Center. Using a NASA modeling system called MERRA-2 (Modern-Era Retrospective analysis for Research and Applications-2) to analyze long-term trends, the NASA team calculated that summer heat waves in the U.S. roughly doubled in number between 1980 and 2023, increasing from an average of two to four per month.
For many years, climate scientists working with the Intergovernmental Panel on Climate Change (IPCC) and NASA have pointed out that the frequency and intensity of heatwaves have increased in recent decades because of the rising concentrations of greenhouse gases in the atmosphere. They expect these increases to continue in the future.
“We have warmed up the planet by about two degrees Fahrenheit in the last century or so,” said Gavin Schmidt, the director of NASA’s Goddard Institute for Space Studies, in a story published in 2022. “That is juicing the extremes, so the number of times places are exceeding 90 or 100 degrees Fahrenheit is going up—and not just by a little bit. It’s gone up four, five, seven times more than before.”
NASA Earth Observatory image by Lauren Dauphin, using GEOS-5 data from the Global Modeling and Assimilation Office at NASA GSFC. Story by Adam Voiland.