Another hurricane season in the Atlantic and eastern Pacific ocean basins has come to a close, and it was a busy one. During an average season, the two basins see 29 named storms. In 2023, there were 37.
Just a few of these struck land as major hurricanes—Idalia in the Atlantic and Lidia and Otis and in the Pacific. However, of all the storms that roiled these two basins, nearly one third had bouts of “rapid intensification”—meaning wind speeds increased by at least 35 miles (56 kilometers) per hour, over 24 hours.
That in itself is not unusual. But what did attract notice from meteorologists was that a handful of 2023 storms not only cleared the threshold for rapid intensification but soared past it. In the Atlantic, Idalia and Lee both saw winds increase by nearly 58 miles per hour (mph) within a 24-hour period, enough for some storm watchers to classify them as “extreme rapid intensification” events. In the eastern Pacific, Hilary, Jova, Otis, and Lidia did the same. Otis was particularly mighty. Its winds surged by 115 mph within 24 hours, more than any other storm on record in the eastern Pacific aside from Hurricane Patricia in 2015.
Rapidly strengthening storms can cause catastrophic levels of damage if they strengthen right before making landfall. That gives little time for warnings and evacuations, compounding the problem that rapid intensification is typically quite challenging to forecast. Current models accurately forecast rapid intensification only about one third of the time. Forecast errors for storms that undergo rapid intensification are approximately 2 to 3 times larger than for other storms, according to one analysis.
Scientists working with NASA’s TROPICS (Time-Resolved Observations of Precipitation structure and storm Intensity with a Constellation of Smallsats) mission aim to change that. They are collecting and analyzing data from the constellation of five satellites to better understand what triggers certain storms to intensify rapidly. Eventually, they expect data and insights gleaned from TROPICS will be used to fine-tune weather models and improve forecasts of hurricane intensity.
The 2023 hurricane season provided the TROPICS science team with its first chance to analyze TROPICS observations for a full season. They collected data about the structure of all Atlantic and eastern Pacific basin storms, as well as some storms in other parts of the world.
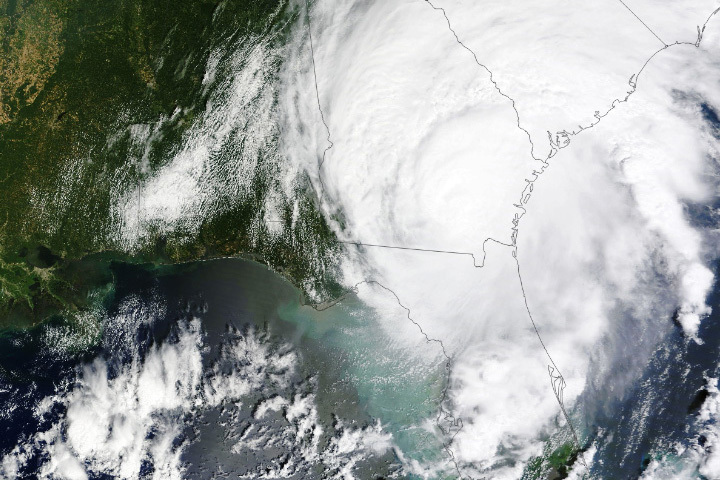
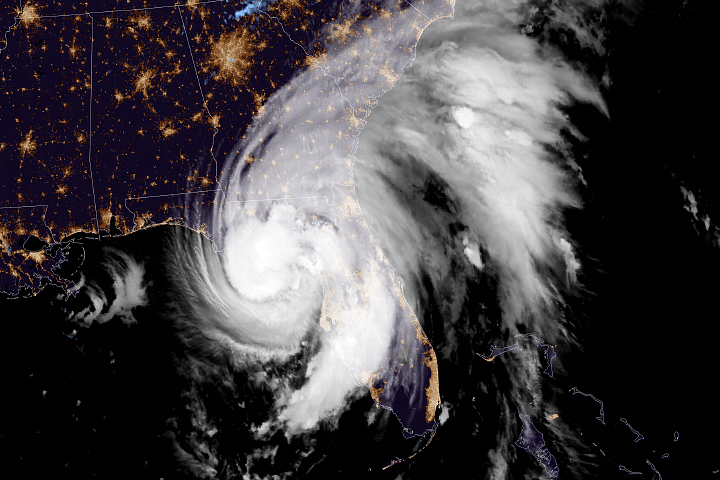
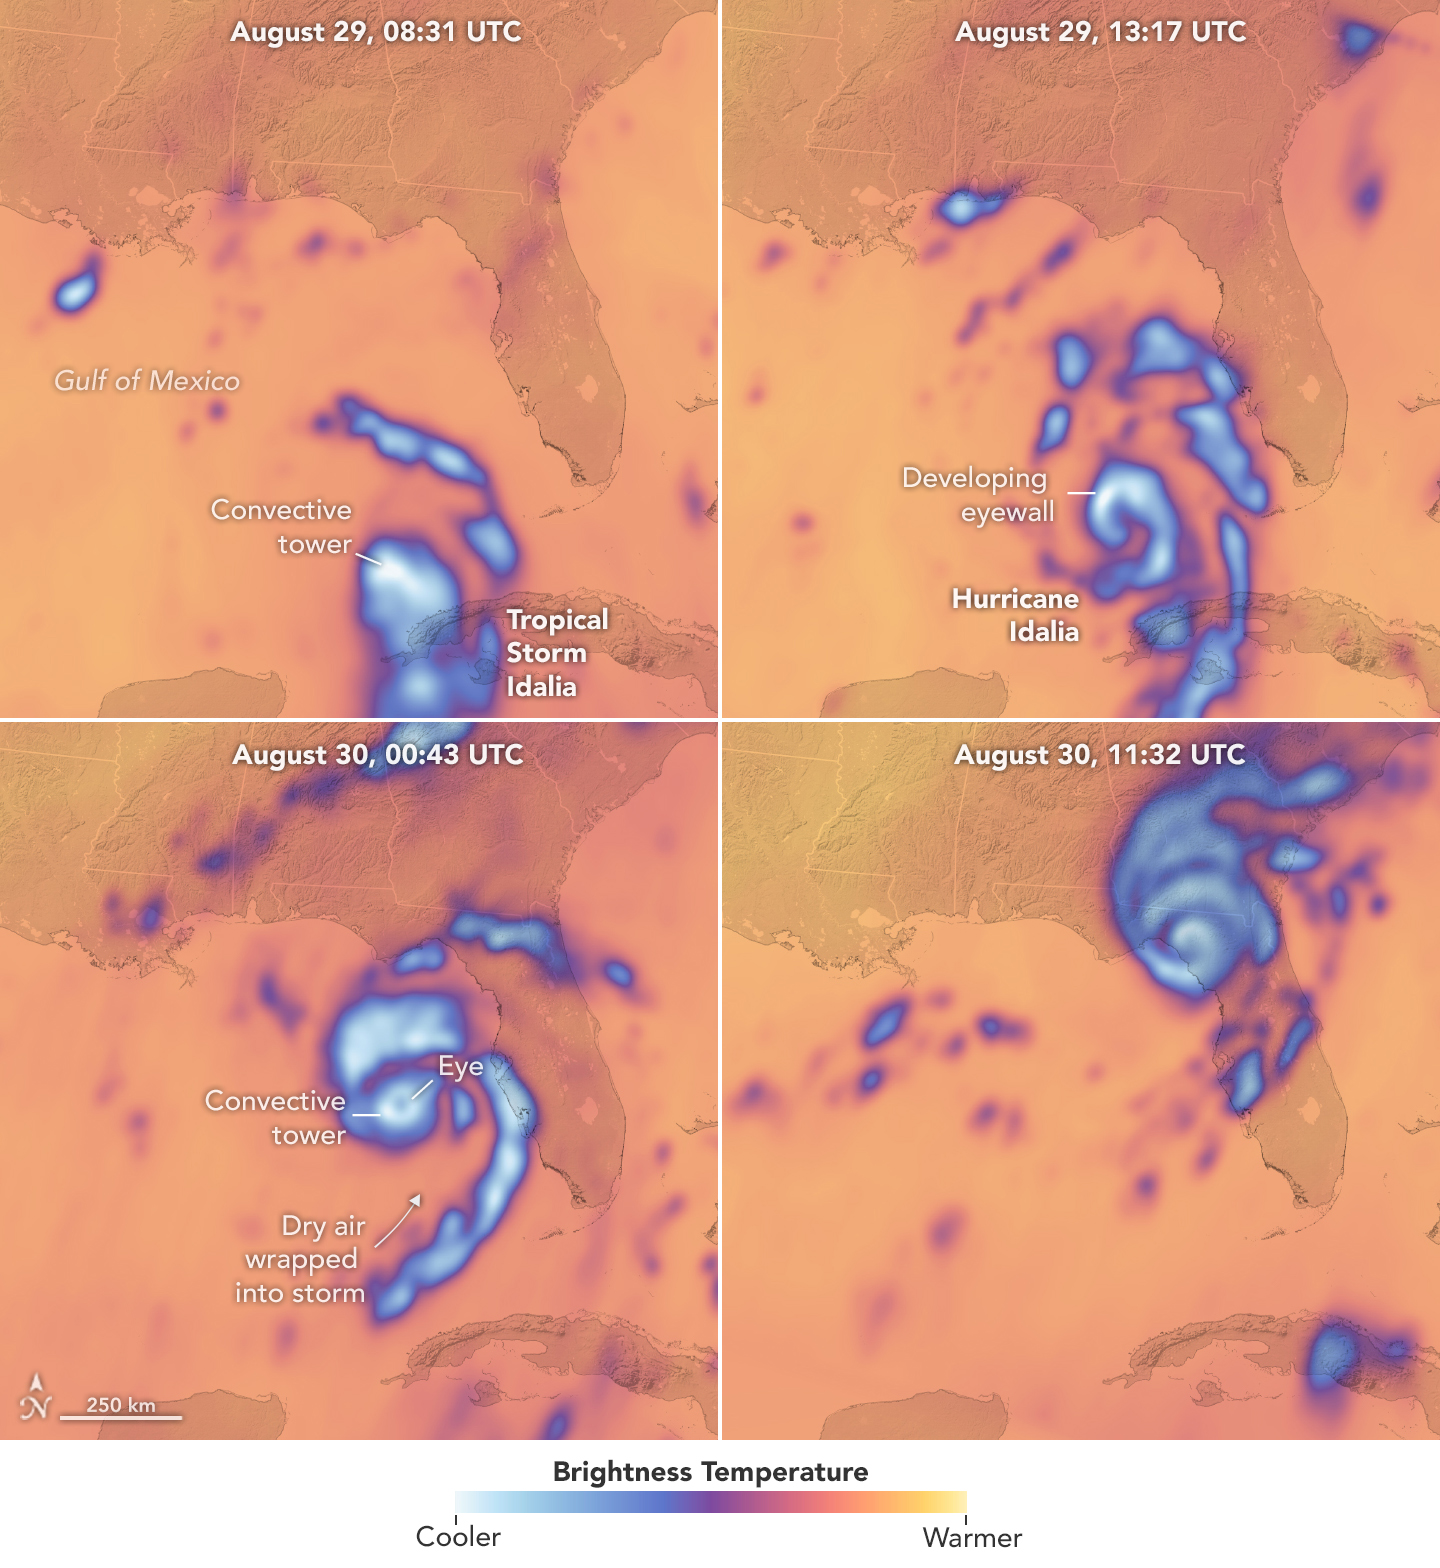
The images at the top of the page highlight TROPICS observations of Idalia—the most damaging hurricane to hit the United States in 2023—as the storm underwent rapid intensification and hit the coast of Florida on August 29 and 30. Each scene shows brightness temperature: that is, the intensity of radiation detectable at a certain frequency moving upward from the top of the storm toward the satellites. Cold brightness temperatures (blue and white) represent radiation that has been scattered by ice particles in the storm clouds, revealing information about the storm’s precipitation. The coolest temperatures are generally associated with the tallest clouds.
“If the infrared satellite imagery of hurricanes you typically see on the news is like looking at a photograph of just the cloud tops, TROPICS images are more like X-rays,” said Patrick Duran, the TROPICS mission applications lead. “Microwave sounders allow us to see below the cloud tops into the inner structure of the storm, where some of the processes most important for intensification occur.”

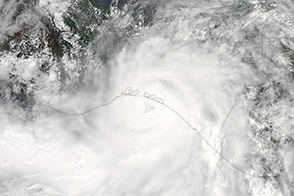
A storm’s structural changes are less apparent in natural-color and infrared images, which primarily show the tops of clouds. The natural-color photograph above, taken from the International Space Station, shows Idalia on August 30, 2023, soon after the storm made landfall.
TROPICS also provides more frequent microwave observations than researchers have had before. Each of the five TROPICS satellites contains a sounder that collects data across 12 channels to detect temperatures, moisture, and precipitation around and within storms. The configuration makes it possible to sample storms about once every hour on average.
“In Idalia’s case, those frequent overpasses allowed for improved tracking of changes in storm precipitation structure and intensity from a highly sheared, disorganized tropical storm to a rapidly intensifying, well-organized hurricane over a period of a day and a half,” said Scott Braun, the NASA TROPICS project scientist at Goddard Space Flight Center. Vertical wind shear, the change in wind speed and direction with altitude, can cause a vertical tilt of the storm circulation and shift precipitation to one side of the storm center. As shear weakens, the storm becomes more upright, precipitation begins to surround the storm center to form an eye, and intensification often ensues, Braun said.
At 8:31 Universal Time (4:31 am local time) on August 29 (top left), winds from the Category 1 storm had reached 75 mph. Five hours later (top right) image, tall columns of thunderstorms—sometimes called convective towers or hot towers—had begun to build an eyewall north of the strengthening storm’s center of circulation. Sixteen hours later (lower left), a clear eye had formed, the rain bands had become more symmetrical, and winds had surged to 110 mph. Idalia hit its peak strength, with 130 mph winds, a few hours later. By 11:32 UTC on August 30 (lower right), the storm was weakening after making landfall in Florida’s Big Bend region.
The cross-track microwave sounders operating on other current satellites observe up to only 190 gigahertz (GHz), but a new channel at 205 GHz allowed TROPICS to make detailed observations of ice particles that yielded new information about storm structure, said William Blackwell, the TROPICS principal investigator and an atmospheric scientist at the Massachusetts Institute of Technology. “That was a real triumph,” he said. “When coupled with the improved revisit rate of TROPICS, this kind of information could yield improved intensity forecasts.”
Intensity forecasts were quite accurate for Idalia largely because aircraft observation of structural features like precipitation were assimilated into forecast models. “Many storms don’t have aircraft reconnaissance, especially storms that are far from land or in other ocean basins,” Braun said. “For these storms, observations of the structure by TROPICS could fill a critical information gap.”
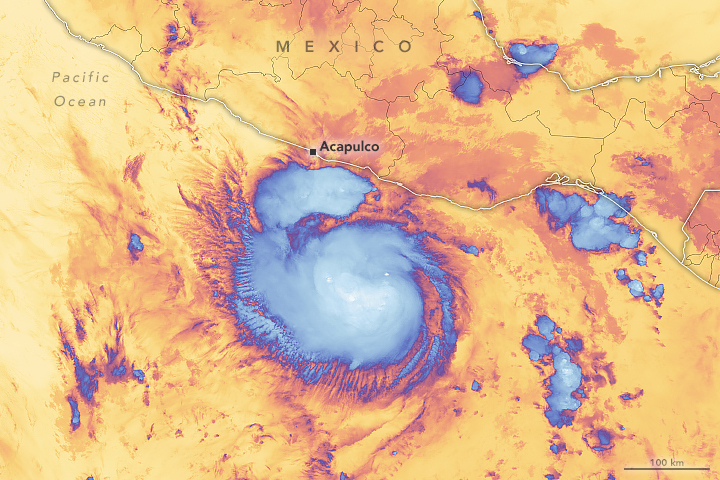
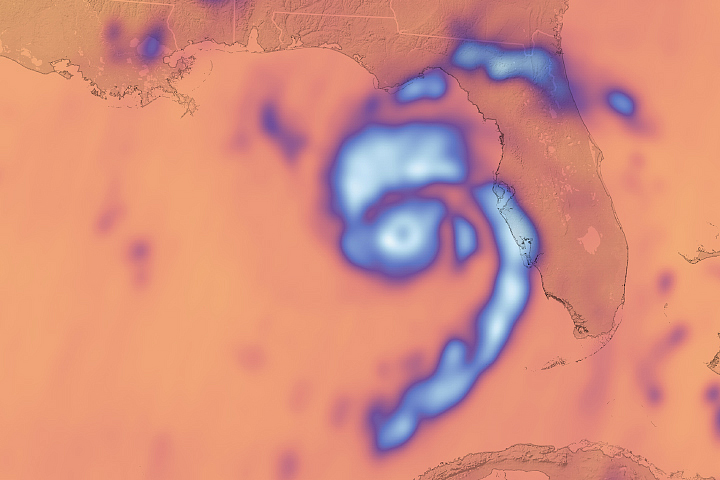
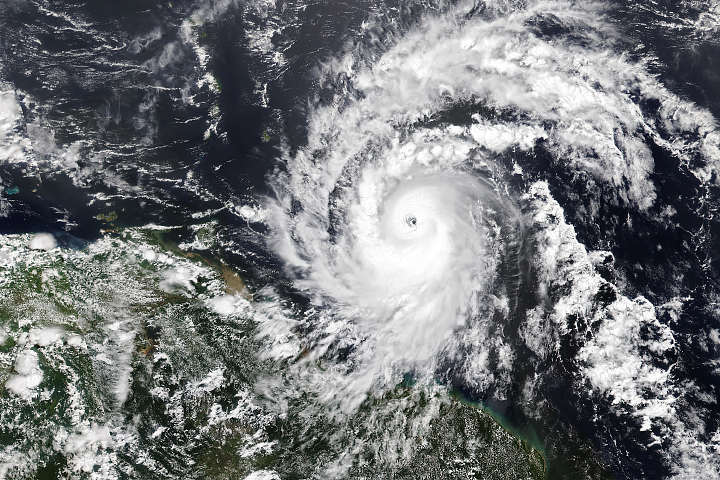
One 2023 forecast that might have benefited from additional data and monitoring in 2023 was for Otis. A day before landfall (shown above with data from the NOAA-20 satellite), most models called for Hurricane Otis to hit western Mexico as a weak tropical storm. Instead, it ballooned into a category 5 monster that battered Acapulco, taking the lives of dozens of people and causing damages that exceeded $2.5 billion.
One of the goals of TROPICS is to improve understanding of the relationship between broader environmental conditions, storm structure, and rapid intensification. Warm sea surface temperatures, excess ocean heat content (a measure of the water temperature below the surface), and low vertical wind shear are the key environmental conditions required for rapid intensification, but only a subset of storms that encounter these favorable conditions undergo rapid intensification.
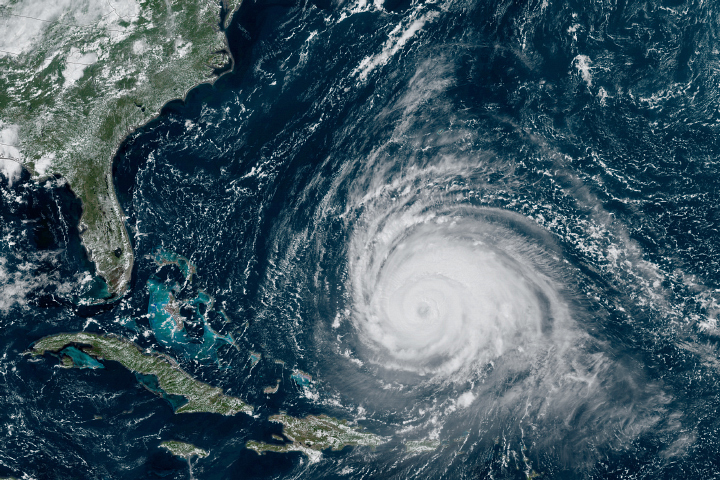
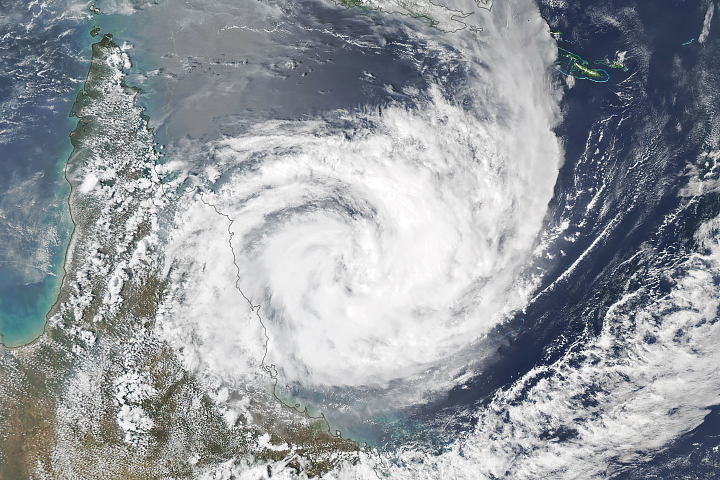
Many hurricane experts think record-breaking sea surface temperatures likely helped fuel the rapid intensification of several storms in 2023. Hurricane Lee, for instance, surged from a tropical storm to category 5 status in the Central Atlantic between September 6 and September 7.
That rate of intensification surprised many meteorologists, prompting some to call the surge in winds an example of “hyper-intensification.” It made Lee the seventh hurricane in the satellite era to intensify by 80 mph or more in 24 hours. It also put Lee in the top .04 percent of all 24-hour intensity changes in the Atlantic, said Kieran Bhatia, head of climate solutions for the Americas for the reinsurance brokerage Guy Carpenter and the author of a 2022 study that analyzed global trends in rapid intensification.
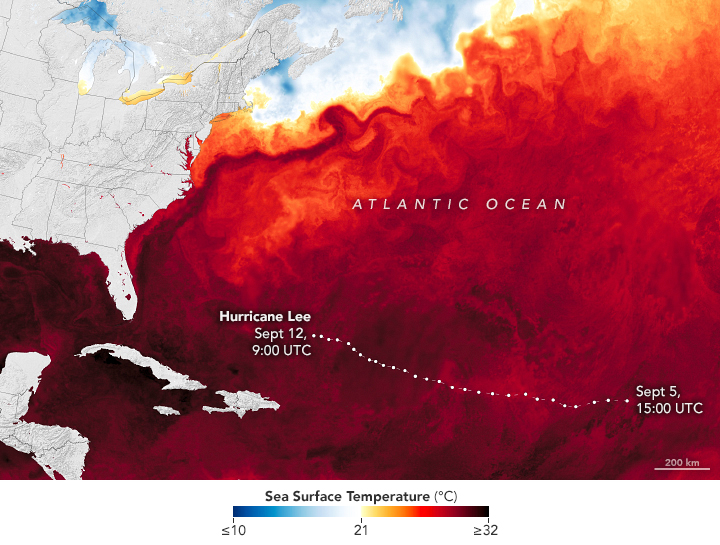
Both Idalia and Lee passed over water with sea surface temperatures that were 4 degrees Fahrenheit (2°C) above average as they were strengthening, suggesting that the extra heat available to the storms likely helped fuel their rapid intensification.
Bhatia and colleagues have documented upward trends in tropical cyclone rapid intensification in several basins in recent decades. They have also presented evidence indicating that the thermodynamic environment—sea surface temperatures and maximum potential intensity—around storms has become more favorable for rapid intensification since 1980, as greenhouse gases accumulated in the atmosphere and the globe warmed.
“We do see signs that climate change may be contributing to an observed increase in the proportion of rapidly intensifying hurricanes on a global scale,” Bhatia said. “But this type of research is still in its infancy. Before we can say there is a direct link between climate change and tropical cyclone intensification trends, we need a new generation of global climate models that can better resolve the finer scale processes of the most intense hurricanes.”
NASA Earth Observatory images by Lauren Dauphin, using data provided by the TROPICS team. Astronaut photograph of Idalia ISS069-E-084870 was acquired on August 30, 2023, with an Apple camera using a focal length of 1 millimeter. Image of Otis by Michala Garrison, using VIIRS data from NASA EOSDIS LANCE, GIBS/Worldview, and the Joint Polar Satellite System (JPSS). Image of sea surface temperatures and Lee by Lauren Dauphin, using GOES 16 imagery courtesy of NOAA and the National Environmental Satellite, Data, and Information Service (NESDIS) and data from the Multiscale Ultrahigh Resolution (MUR) project. Story by Adam Voiland.
alert message