The Earth Observatory has published its last Image of the Day on this website. Please join us on our new home at science.nasa.gov/earth/earth-observatory.
With winter in full swing, the Wasatch and Uinta mountains in the Southern Rockies are still building their snowpack. Come springtime, snowmelt will be flowing downstream, delivering important water resources to lakes, reservoirs, and people. The question is: when does all this melting begin?
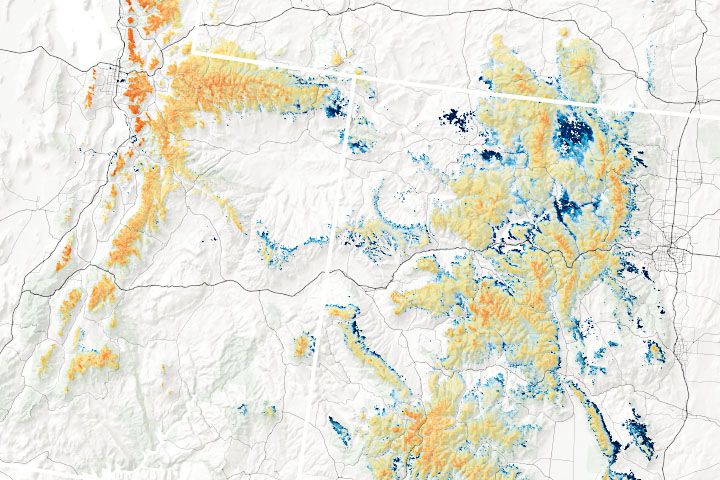
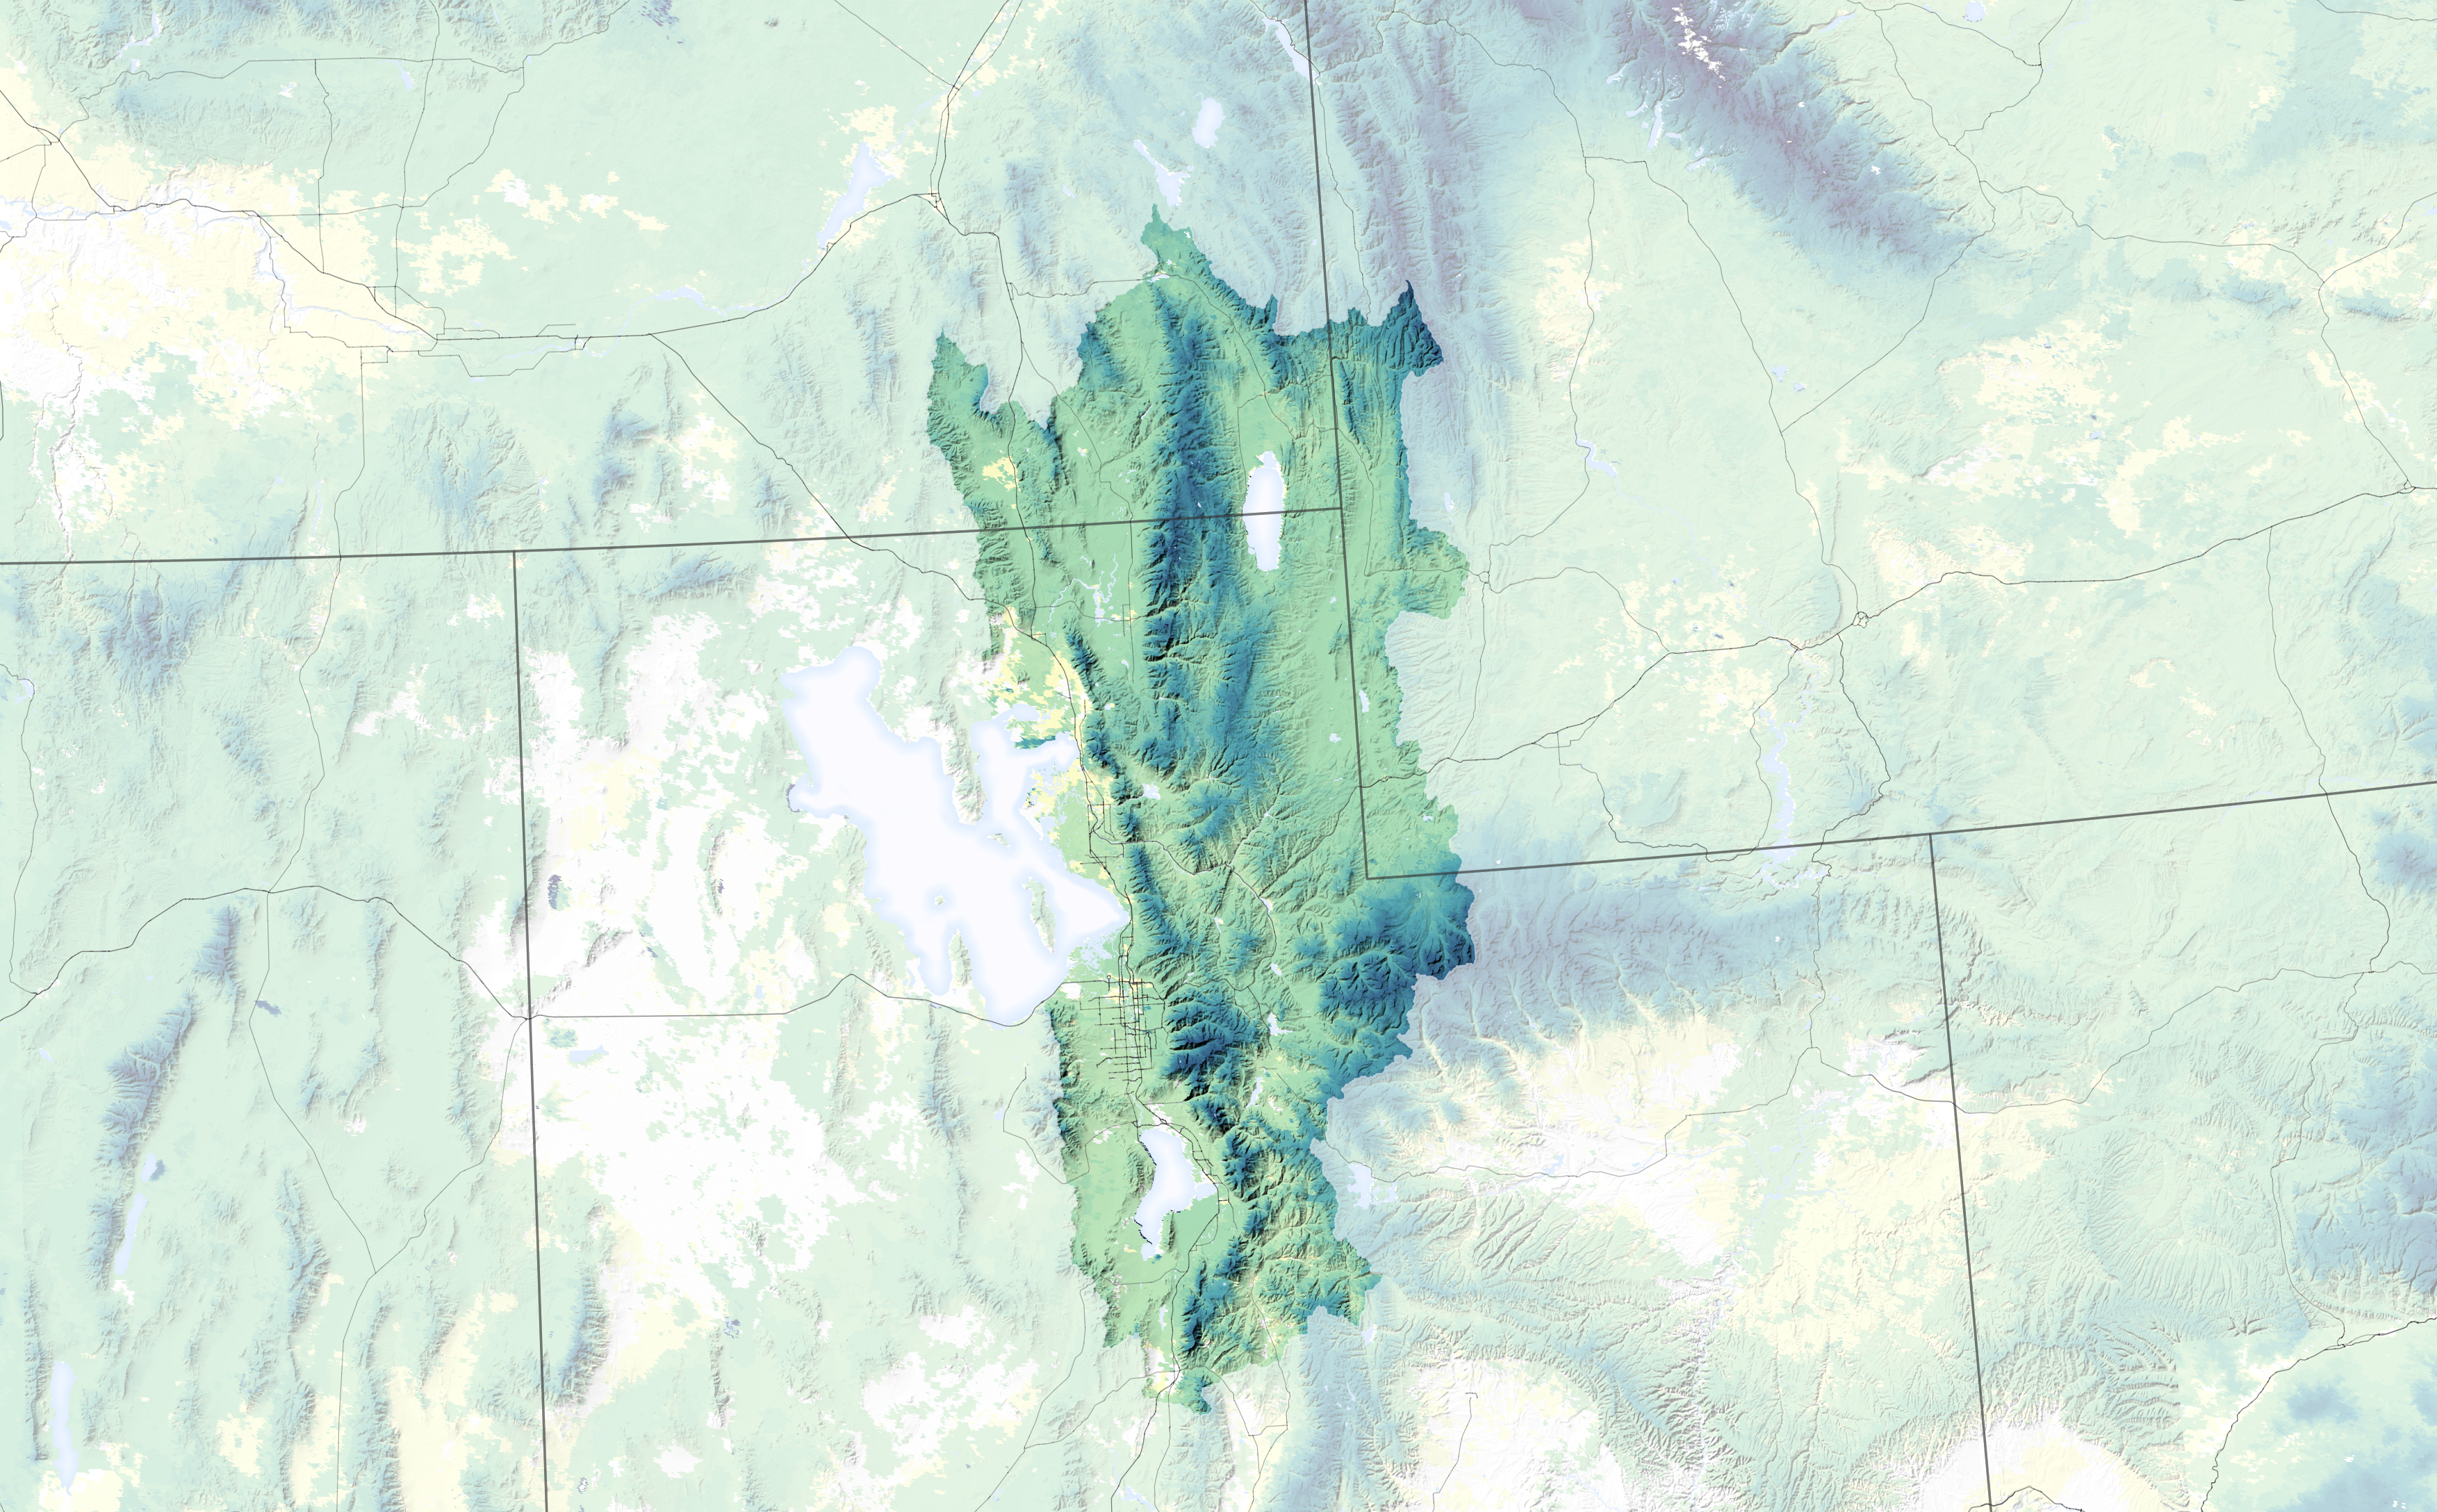
The map above shows the timing of snowmelt within the Great Salt Lake basin in spring 2018, after a particularly bleak year for the region’s snowpack. The basin spans parts of Utah, Idaho, and Wyoming, but only the basin’s eastern side (highlighted above) contributes water to the Great Salt Lake. Areas west of the lake are desert.
The map uses data derived from the Moderate Resolution Imaging Spectroradiometer (MODIS) on NASA’s Terra satellite to indicate the day of the year that each pixel transitioned from snow-covered to snow-free. Melting tends to start at warmer, lower elevations in February (yellow). It follows on for the next several months (darker greens and blues) at ever higher elevations.
“Most of North America is covered in snow in the winter, but the timing of when the snow comes and goes can be very different from place to place,” said Donal O’Leary, a scientist at Battelle Memorial Institute’s National Ecological Observatory Network, and author of the snowmelt timing maps. “These maps show the date that the snow melted away completely, exposing the bare earth below.”
O’Leary noted that snowmelt timing maps have primarily been used in studies of spring vegetation phenology; that is, how the melting of snow influences the emergence of grasses and flowers, which in turn influences things like animal hibernation and migrations.
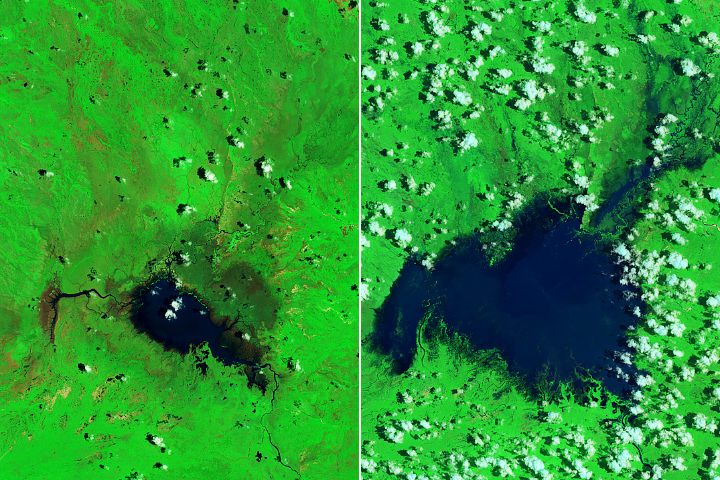
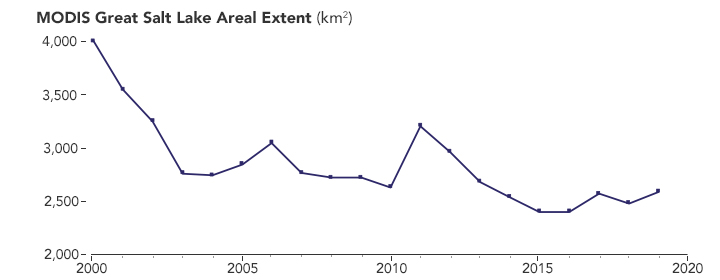
The maps are also helping scientists understand the water cycle around mountains and valleys. In particular, they might help them discern some reasons behind the Great Salt Lake’s recent history of water woes. According to measurements from MODIS, the lake in 2000 spanned 1,550 square miles (4,020 square kilometers). By 2019, it had shrunk by 370 square miles (960 square kilometers)—more than three times the area of Salt Lake City.
The water flowing into the Great Salt Lake comes primarily from streams and rivers (66 percent)—most notably from the Bear, Jordan, and Weber rivers that run down from the mountains. Contributions also come from rain and snow falling directly on and around the lake (31 percent) and from groundwater (3 percent) .
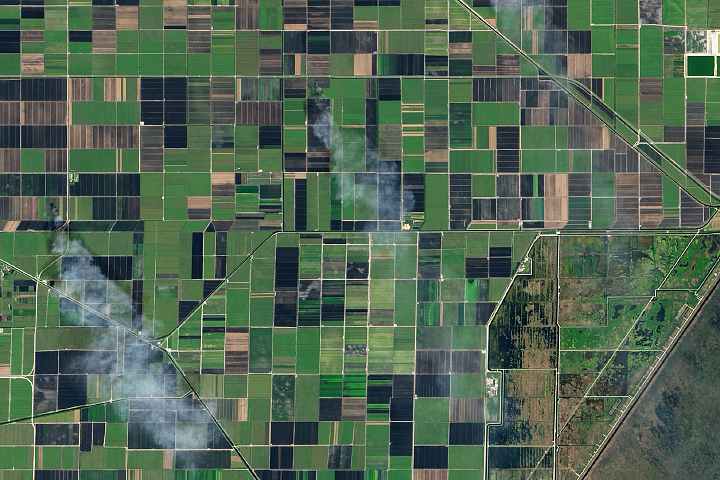
With rivers and streams being the largest source of water, any changes to streamflow can have dramatic effects on lake levels. Long-term drought, combined with the diversion of river water for farming, industry, and human consumption, have caused water levels in the Great Salt Lake to plunge. But rising temperatures and earlier melting in the mountains are also playing a role.
“We have the tools now—satellites and ancillary geophysical data—combined with two decades of MODIS data that allow us to study the environmental contributions to the desiccation of the Great Salt Lake and other terminal lakes,” said Dorothy Hall, a research scientist at the Earth Science Interdisciplinary Center at the University of Maryland.
Hall and colleagues showed in recent research that melting in the Great Salt Lake basin has generally been trending earlier since 2000, the start of the MODIS era. By 2018, snow in the Great Salt Lake basin east of the lake had melted on average more than a week earlier than in 2000.
Premature melting skews the water cycle, allowing more runoff to be lost to the atmosphere through evaporation as the water flows from the mountains to the lake. Hall notes, however, that the relative contribution of this early snowmelt to the lake’s desiccation is not yet clear. “The magnitude of the snowmelt is a very important source of runoff that ends up in the Great Salt Lake,” Hall said. “But so far we have not been able to separate the effects of climate change from the effects of consumption for human uses.”
NASA Earth Observatory images by Lauren Dauphin, using data from Hall, Dorothy, et al. (2021). Story by Kathryn Hansen.