The Earth Observatory has published its last Image of the Day on this website. Please join us on our new home at science.nasa.gov/earth/earth-observatory.
Carlee McClellan has a mission: monitor water supplies and assess drought conditions for the Navajo Nation. Amber McCullum has a mission: make NASA satellite data more useful to resource managers and local communities, particularly underserved communities. Together, McCullum and McClellan are building a web-based tool that does both of those things.
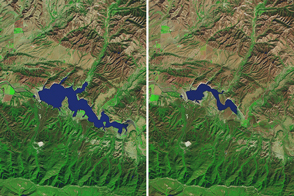
Tucked into the Four Corners region of the U.S. Southwest, the Navajo Nation spans 27,000 square miles (71,000 square kilometers). It is some of the driest territory in North America, with a diverse geography ranging from low-lying desert to the San Juan River valley to the Chuska Mountains. Of the nearly 200,000 Navajo people spread across that land, about 30 percent do not have access to reliable, clean drinking water and roughly 40 percent lack running water in their homes. Some people haul water more than 50 miles to replenish their cisterns.
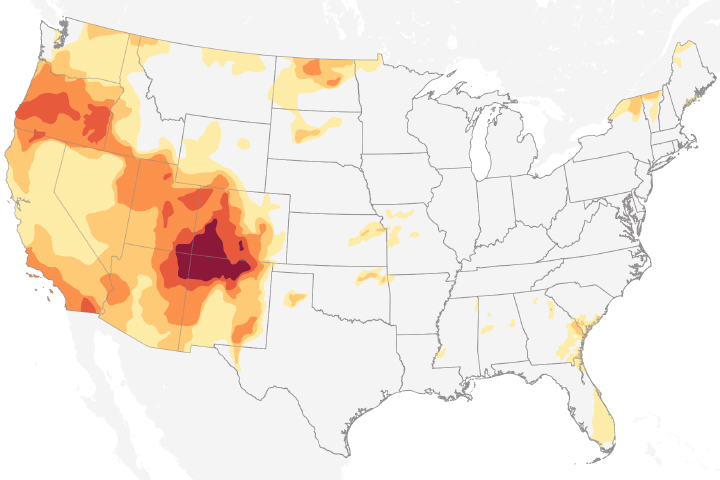
Drought is frequent and pervasive here. It is a nation in need of reliable and detailed information about water resources, whether that water falls from the sky, runs down from snow-capped mountains, or gets pumped up from wells. According to a report from the U.S. Drought Monitor on April 14, 2020, moderate to severe drought conditions were affecting much of the area.
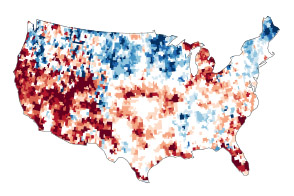
As a senior hydrologist for the Navajo Nation’s Department of Water Resources, McClellan must take stock of that precious water. Until recently, his team had to do so with just 85 rain gauges—unevenly distributed across an area larger than West Virginia—and three satellite-based calculations made separately for the states of Arizona, New Mexico, and Utah.
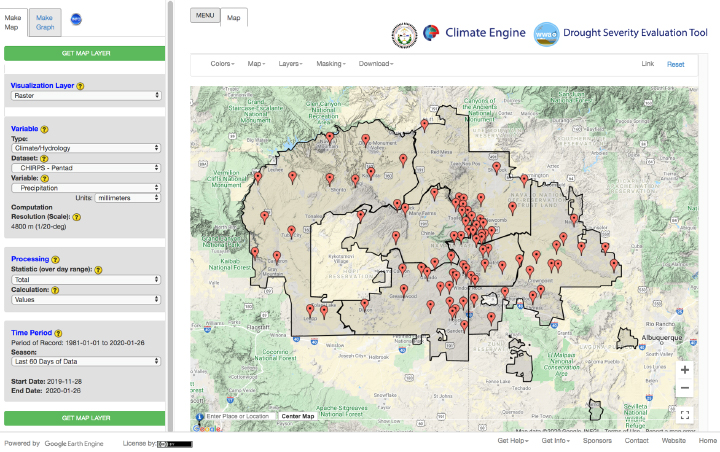
Enter Amber McCullum, NASA’s Western Water Applications Office, and the Desert Research Institute. A remote-sensing scientist at NASA’s Ames Research Center, McCullum has been working with McClellan and colleagues to develop the Drought Severity Evaluation Tool. Ingesting satellite and ground-based data, the tool is designed to help water managers quickly calculate precipitation totals and other indicators of drought across various timescales. Most importantly, it can pinpoint drought severity down to the level of the five agencies and 110 chapters (similar to counties) of the Navajo Nation.
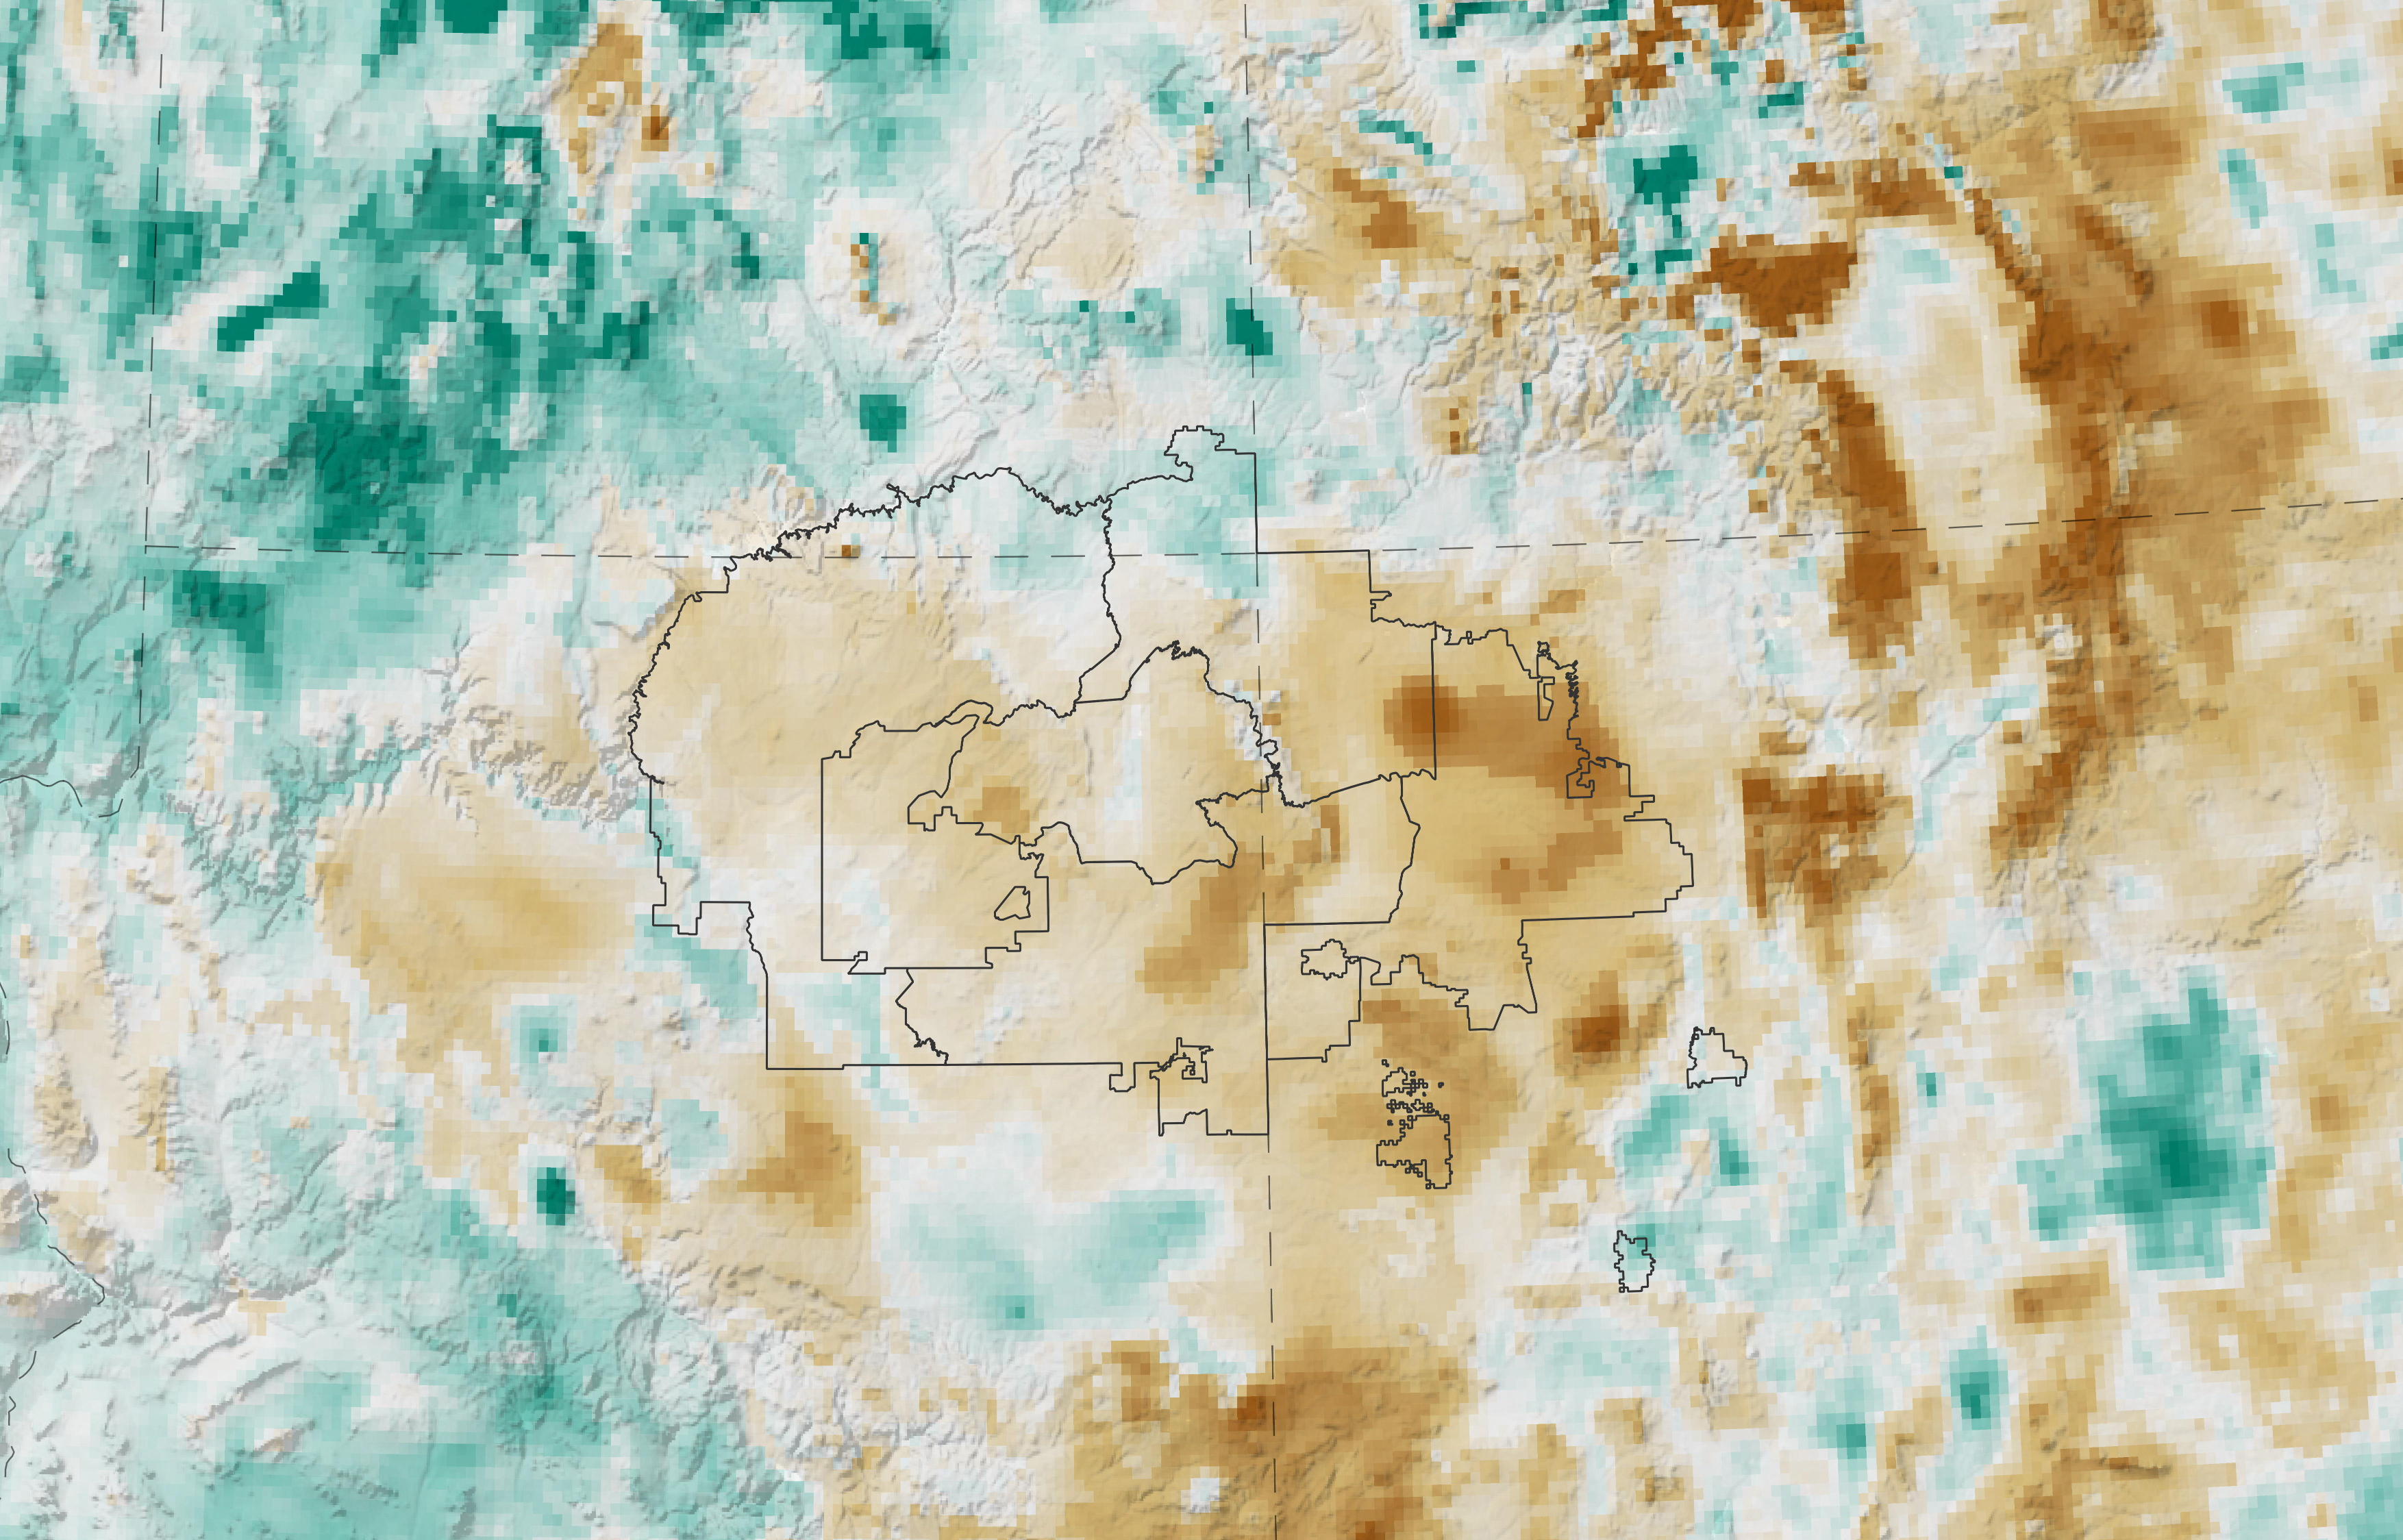
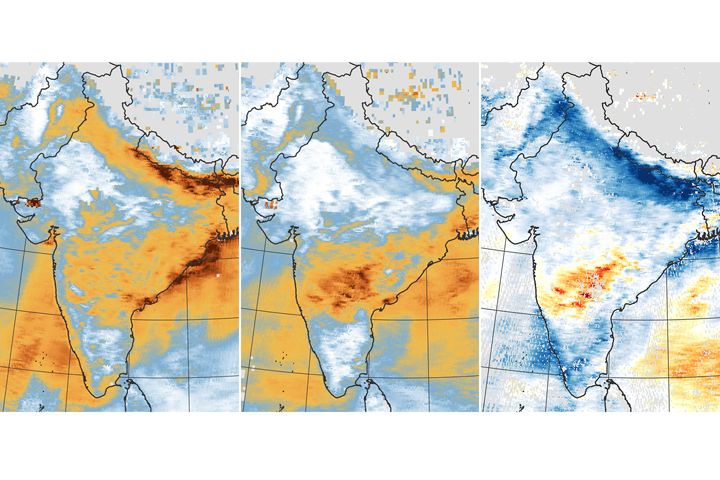
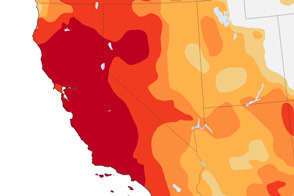
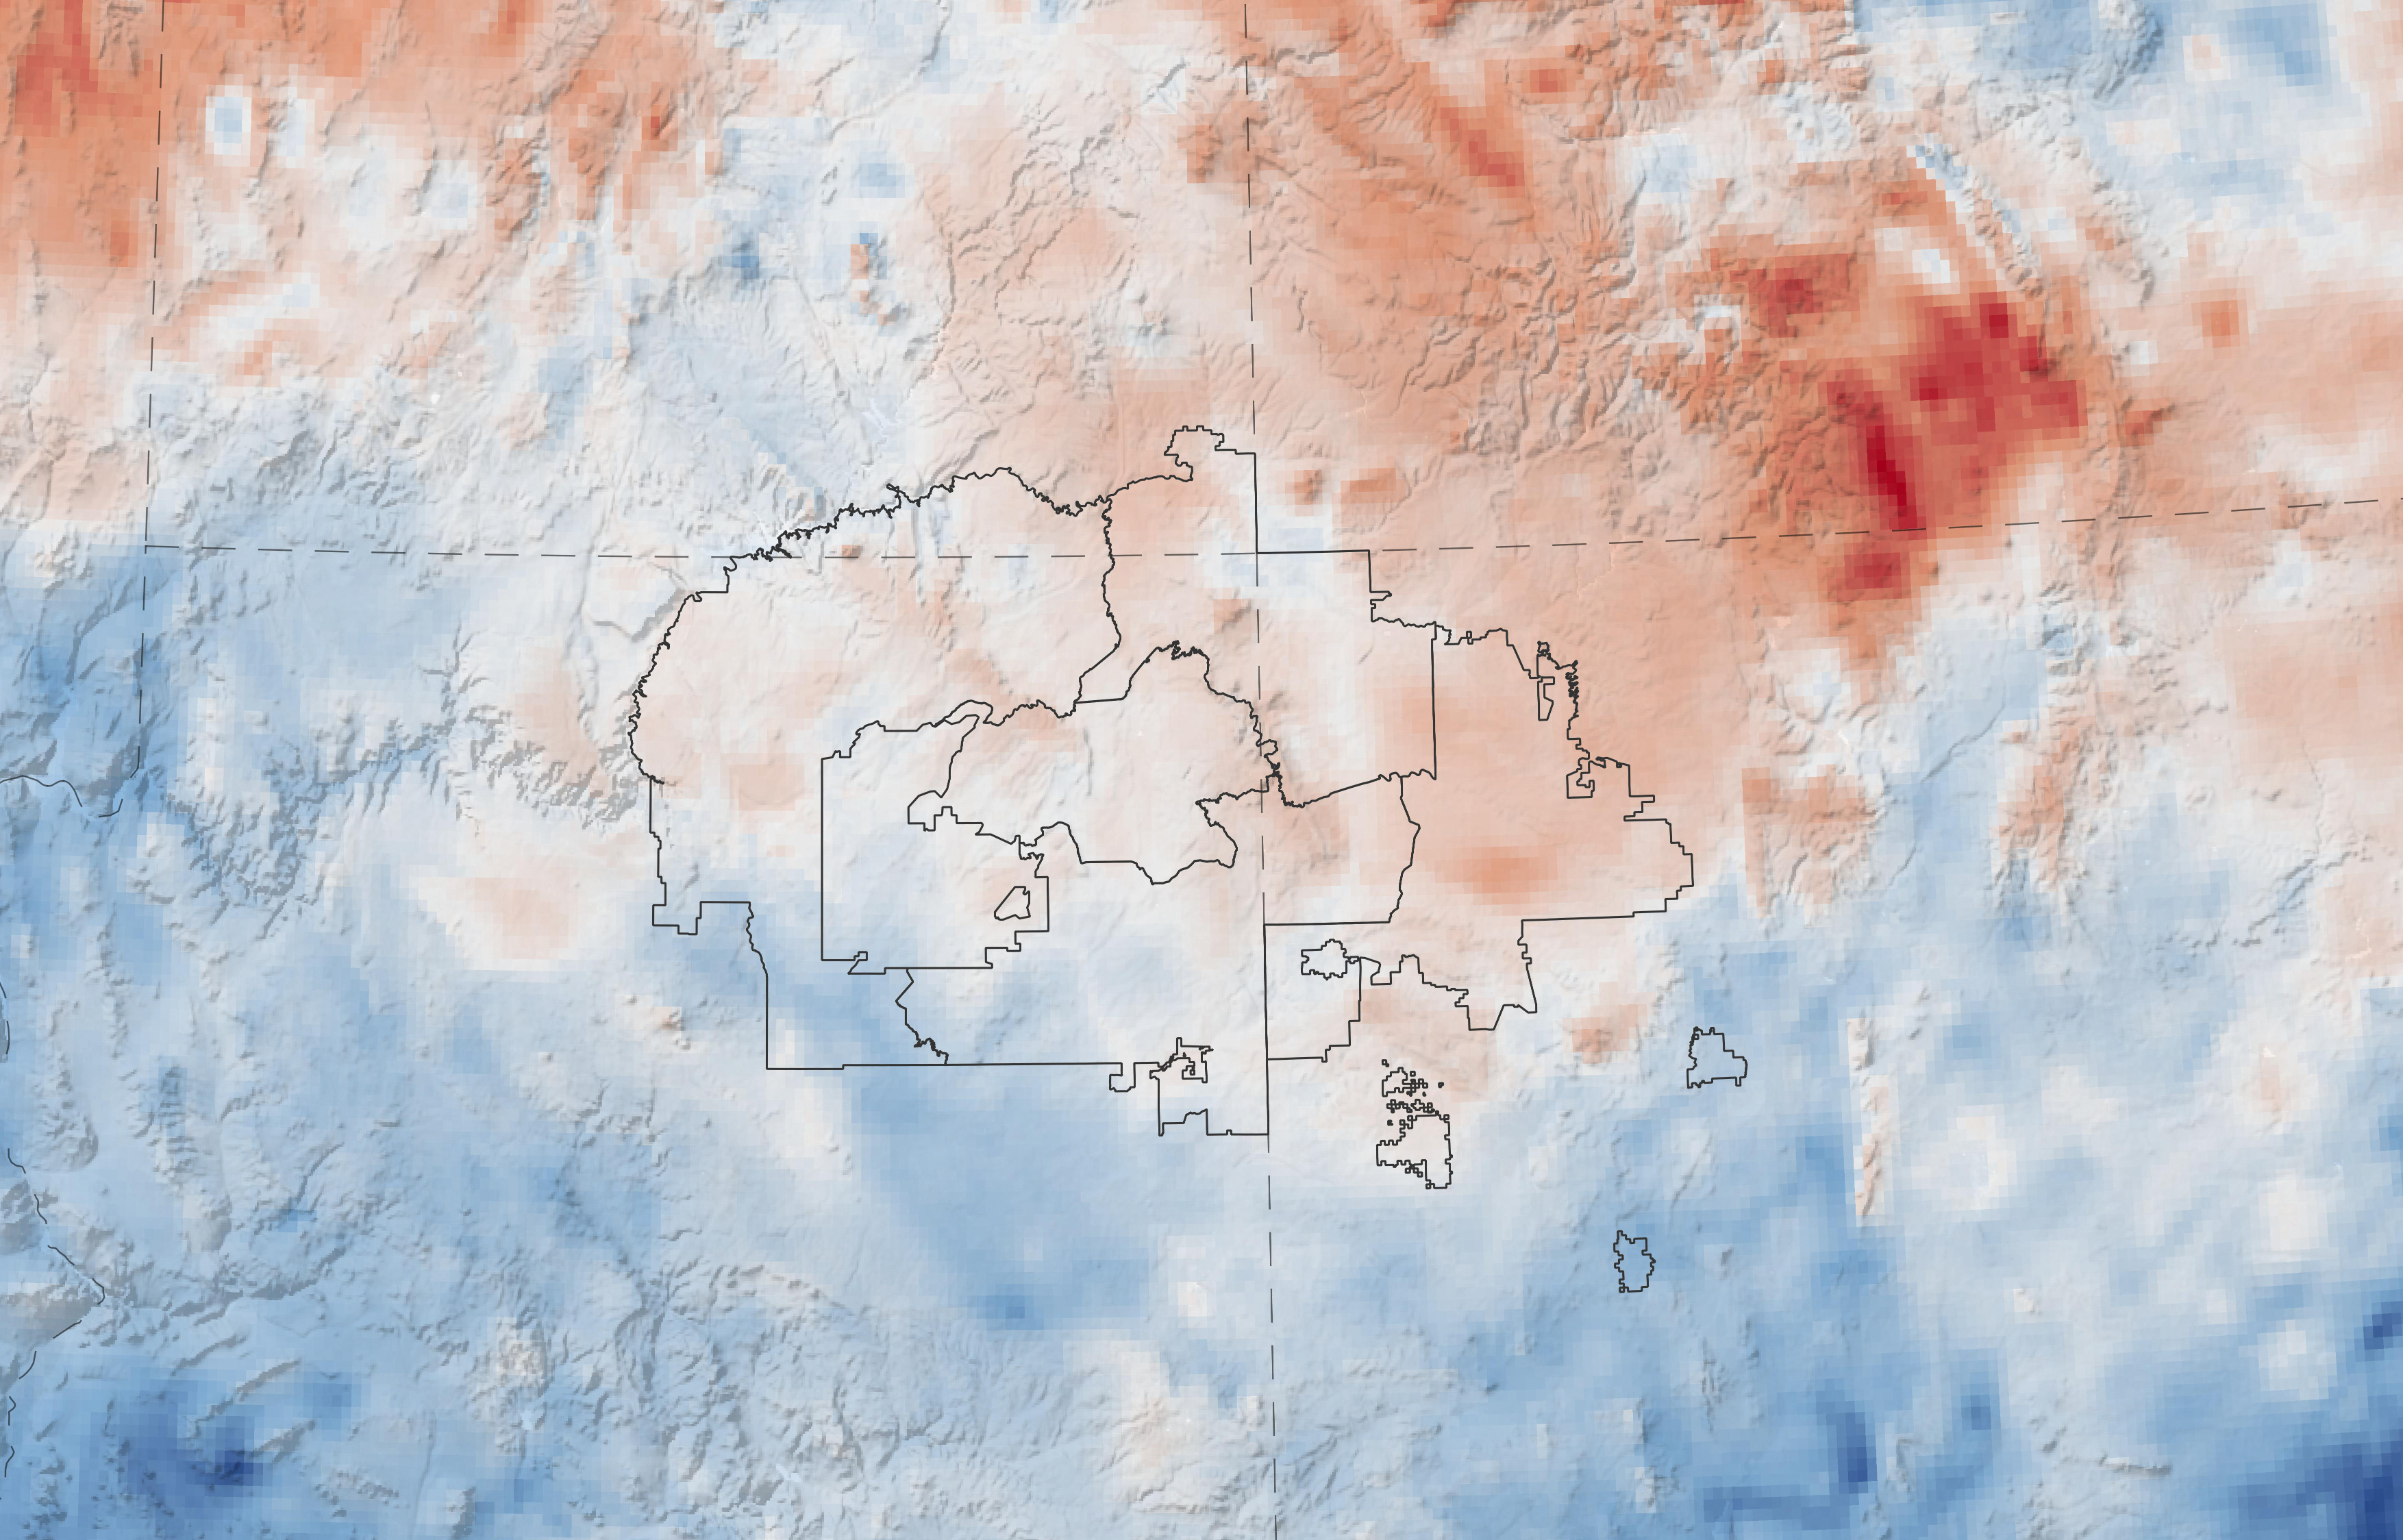
The maps above depict two ways that hydrologists monitor drought. The first map shows a six-month standardized precipitation index (SPI), an estimate of how much recent rainfall has been above or below the long-term average for the period (in this case, September 30, 2019, to April 1, 2020). The second map shows the Palmer Drought Severity Index for the past year; it depicts how wet or dry the landscape is compared to normal for the region. Both measurements are available through the drought evaluation tool, which is undergoing final testing.
First conceived in 2015 through NASA’s DEVELOP Program, the drought tool might help NASA as much as it helps the Navajo Nation. It has been a strong case study in how to build what people need instead of just giving them what you have.
“There is this ‘if-we-build-it-they-will-come’ mentality among scientists. They often think ‘we have these great tools and all these new models for you.’ But then the tools end up never being used,” said McCullum. NASA’s Western Water Applications Office is trying to flip that thinking around. “The most important aspects of these projects are the partners involved and the iterative process. It’s more of a case of ‘what are your needs and what do you want the tool to do?’”
“The tool will allow our Navajo Nation team to evaluate precipitation in a given watershed across any timespan,” McClellan said. It is crucial to parse water information down to specific chapters, agencies, grazing districts, watersheds, and ecoregions because drought relief resources have traditionally been spread across all Navajo chapters evenly. Yet conditions and needs can vary widely, and it would be better to direct scarce resources toward areas that are hardest hit.
McCullum and McClellan plan to make the tool available via web and tablet browser (image above) in the summer of 2020. In the longer term, they hope to integrate other measurements, such as snowpack and indices of vegetation health. “To my surprise, NASA keeps coming back with more creative solutions and possibilities,” McClellan said.
NASA Earth Observatory images by Lauren Dauphin using data from NASA’s Drought Severity Assessment Tool (DSET). Navajo Nation rain gauge locations map courtesy of Amber McCullum. Story by Michael Carlowicz, with reporting from Tovar Cerulli, Amber Jenkins, and Lia Poteet.