The Earth Observatory has published its last Image of the Day on this website. Please join us on our new home at science.nasa.gov/earth/earth-observatory.

Relentless rain pounded Queensland for several weeks in January and February 2019. When the clouds finally moved out, satellites got a clear look at the widespread flooding across the Australian state.
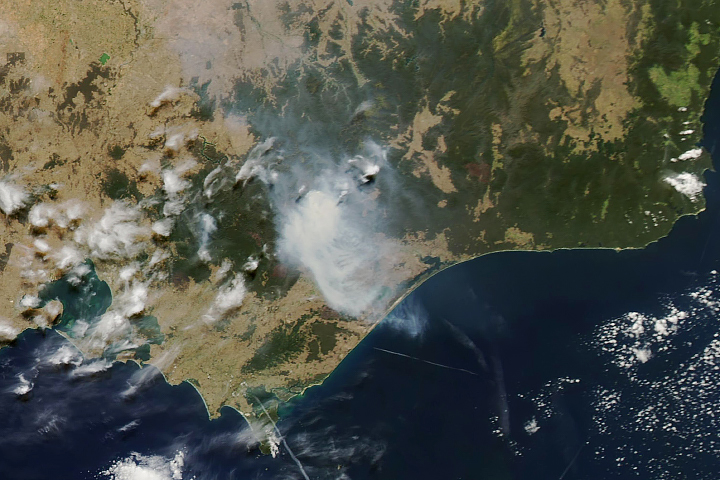
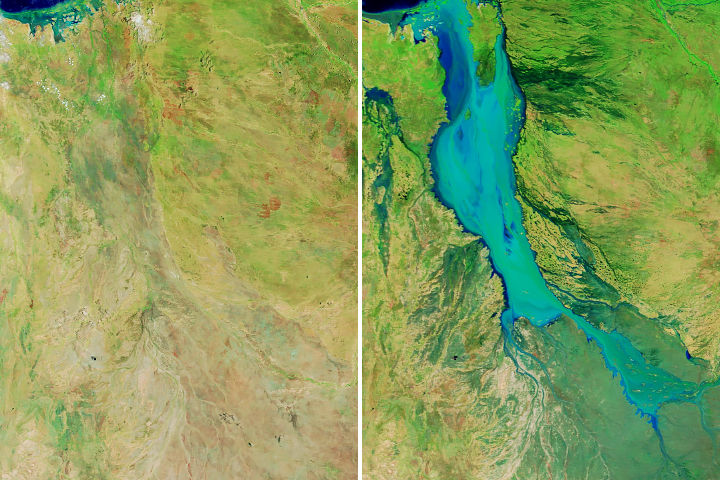
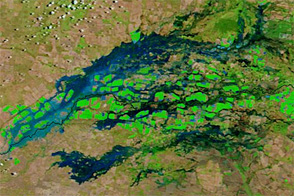
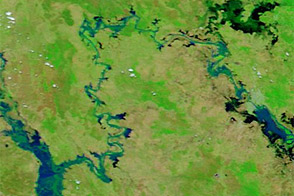
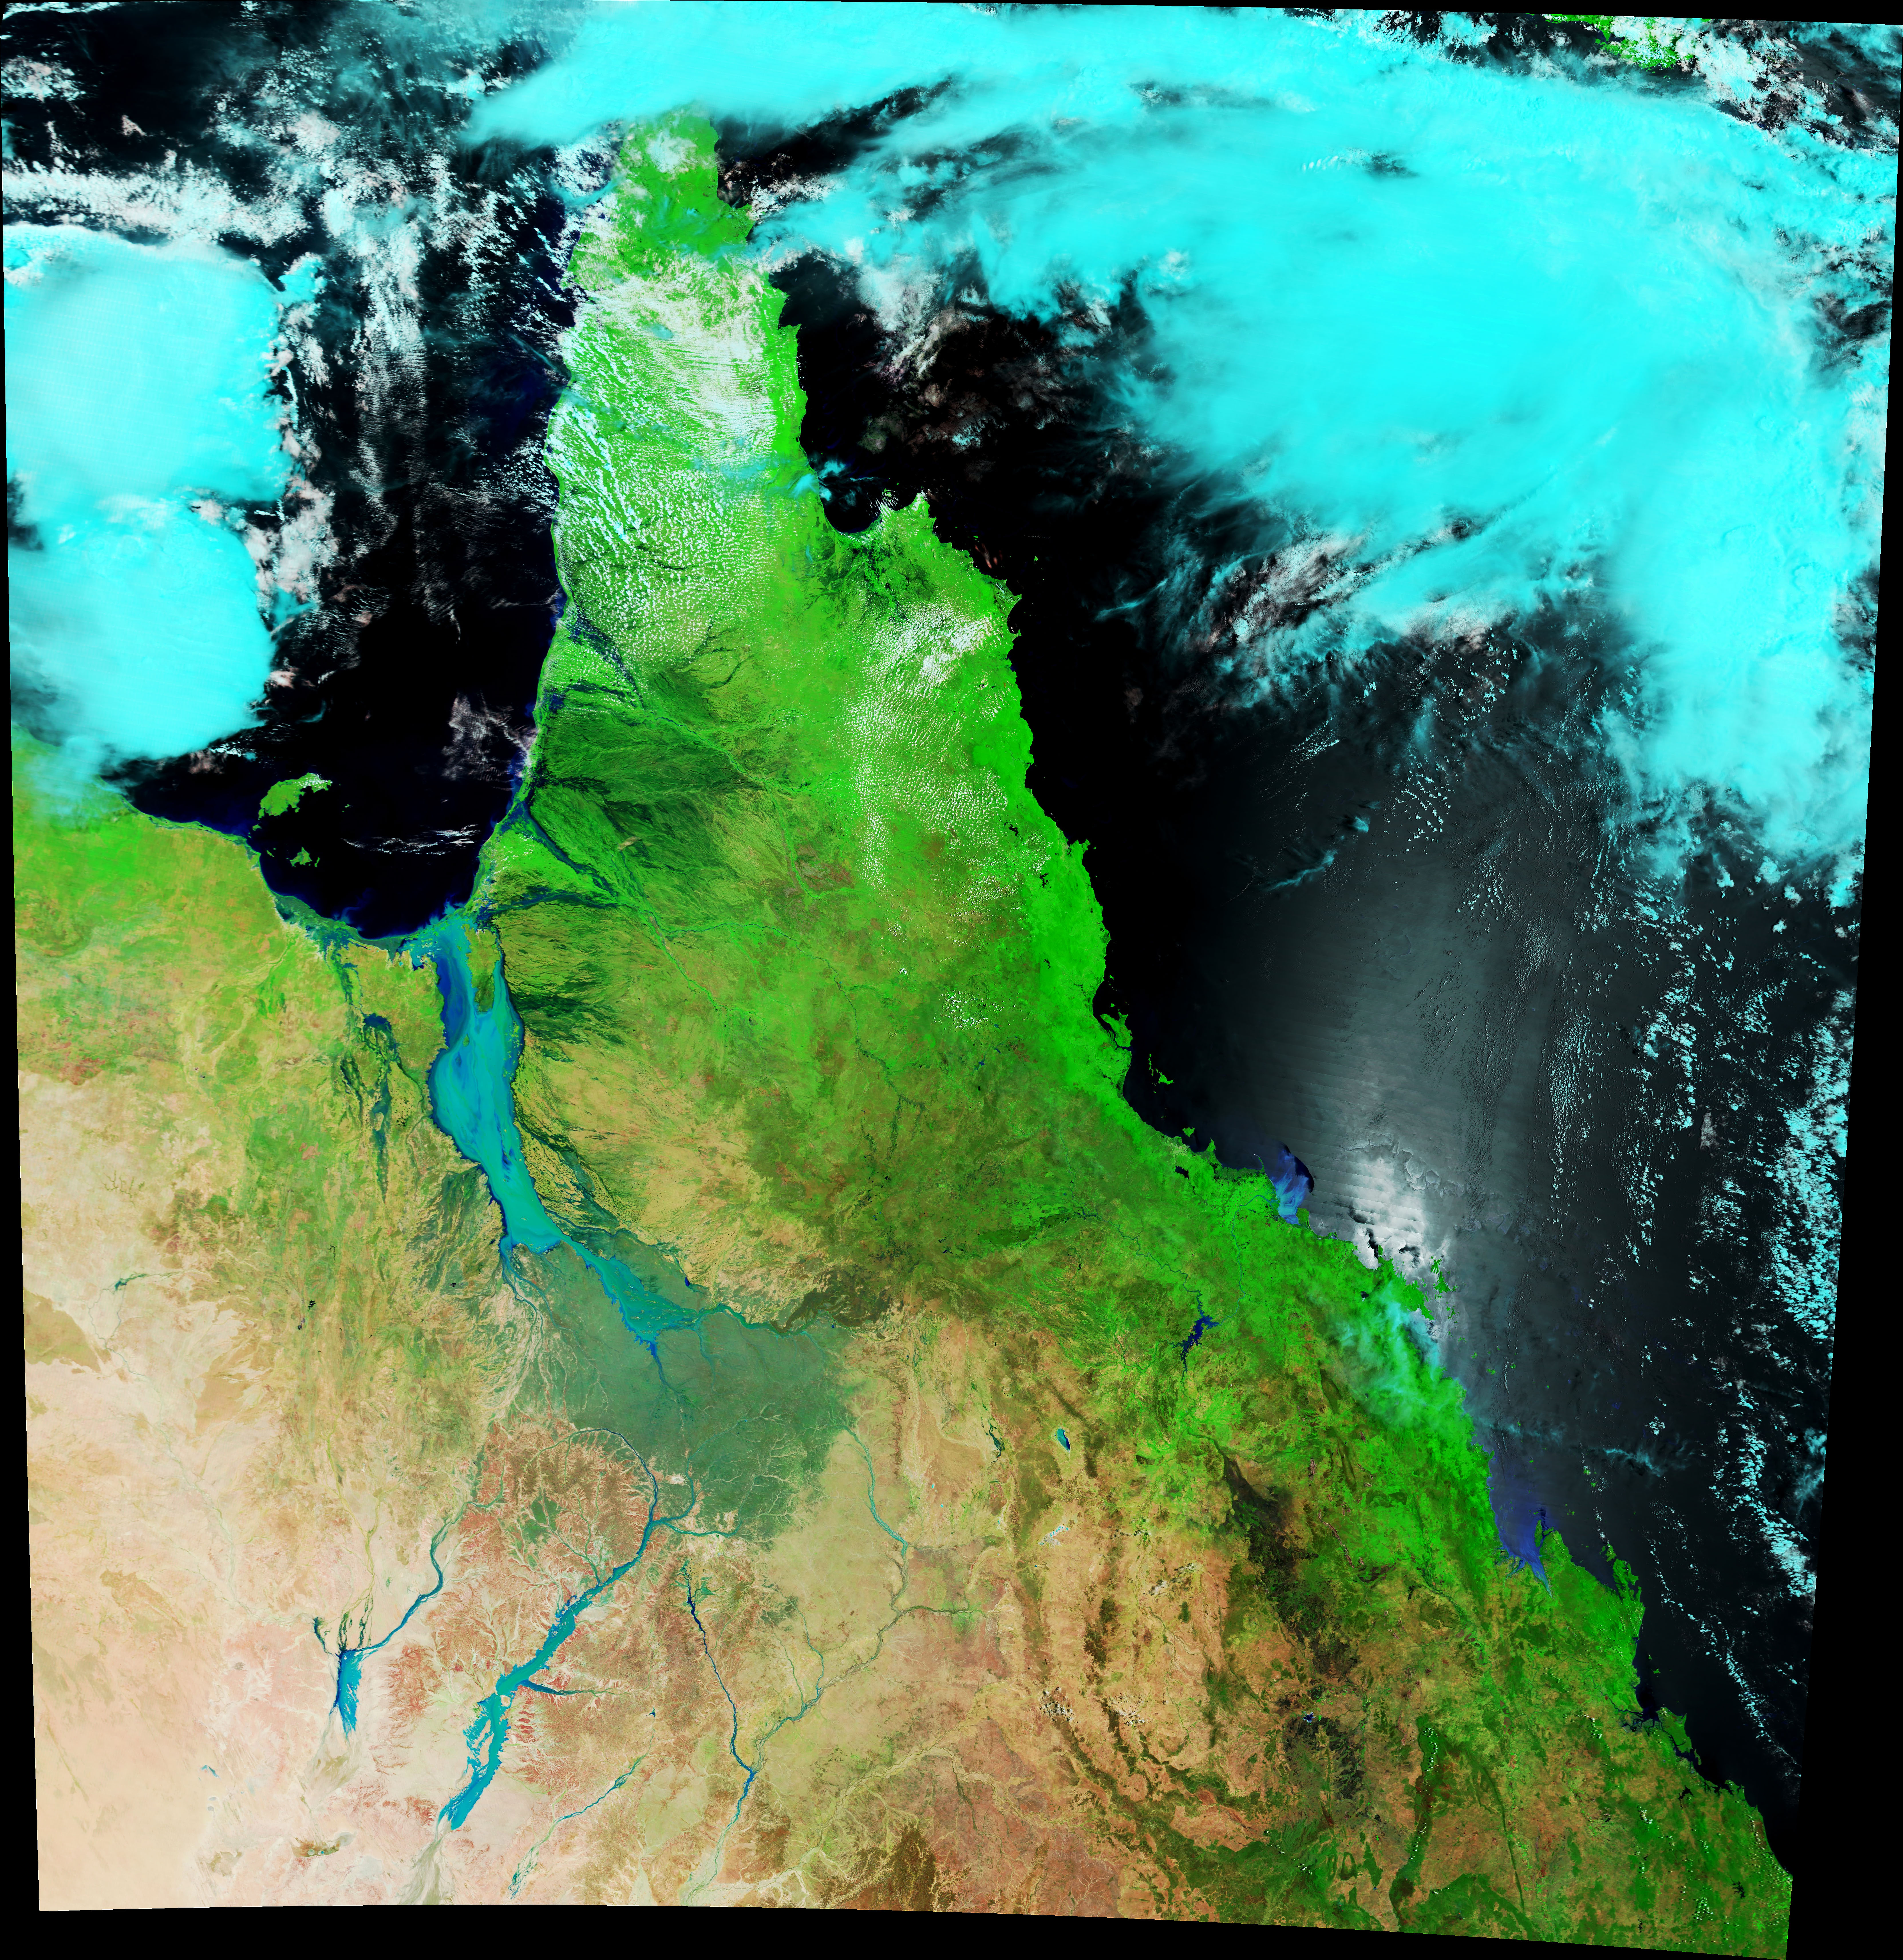
These images show flood waters in North West Queensland along the myriad rivers that flow toward the Gulf of Carpentaria. The Moderate Resolution Imaging Spectroradiometer (MODIS) on NASA’s Terra satellite acquired the first image (left) on January 7, 2019. The second image (right) from Terra MODIS shows the same area on February 10. The false-color images were composed from a combination of infrared and visible light (MODIS bands 7-2-1). Water appears dark and light blue; bare ground is brown; and vegetation is bright green. This band combination makes it easier to see changes in river dimensions.
As of February 10, flood warnings were in effect for the Flinders, Leichhardt, Norman, Nicholson, Gregory, and Gilbert rivers. According to news reports, flooding along the Flinders River was the worst in 50 years. Water spilled from its catchment and merged with floodwater in adjacent river catchments.
The floods in this rural part of Australia meant huge losses for farmers. After working to keep herds alive during years of drought, farmers have now have lost significant numbers of cattle to the flood. The exact numbers are still uncertain, but there are reports of farmers losing entire herds. Estimates of total cattle killed are on the order of hundreds of thousands.
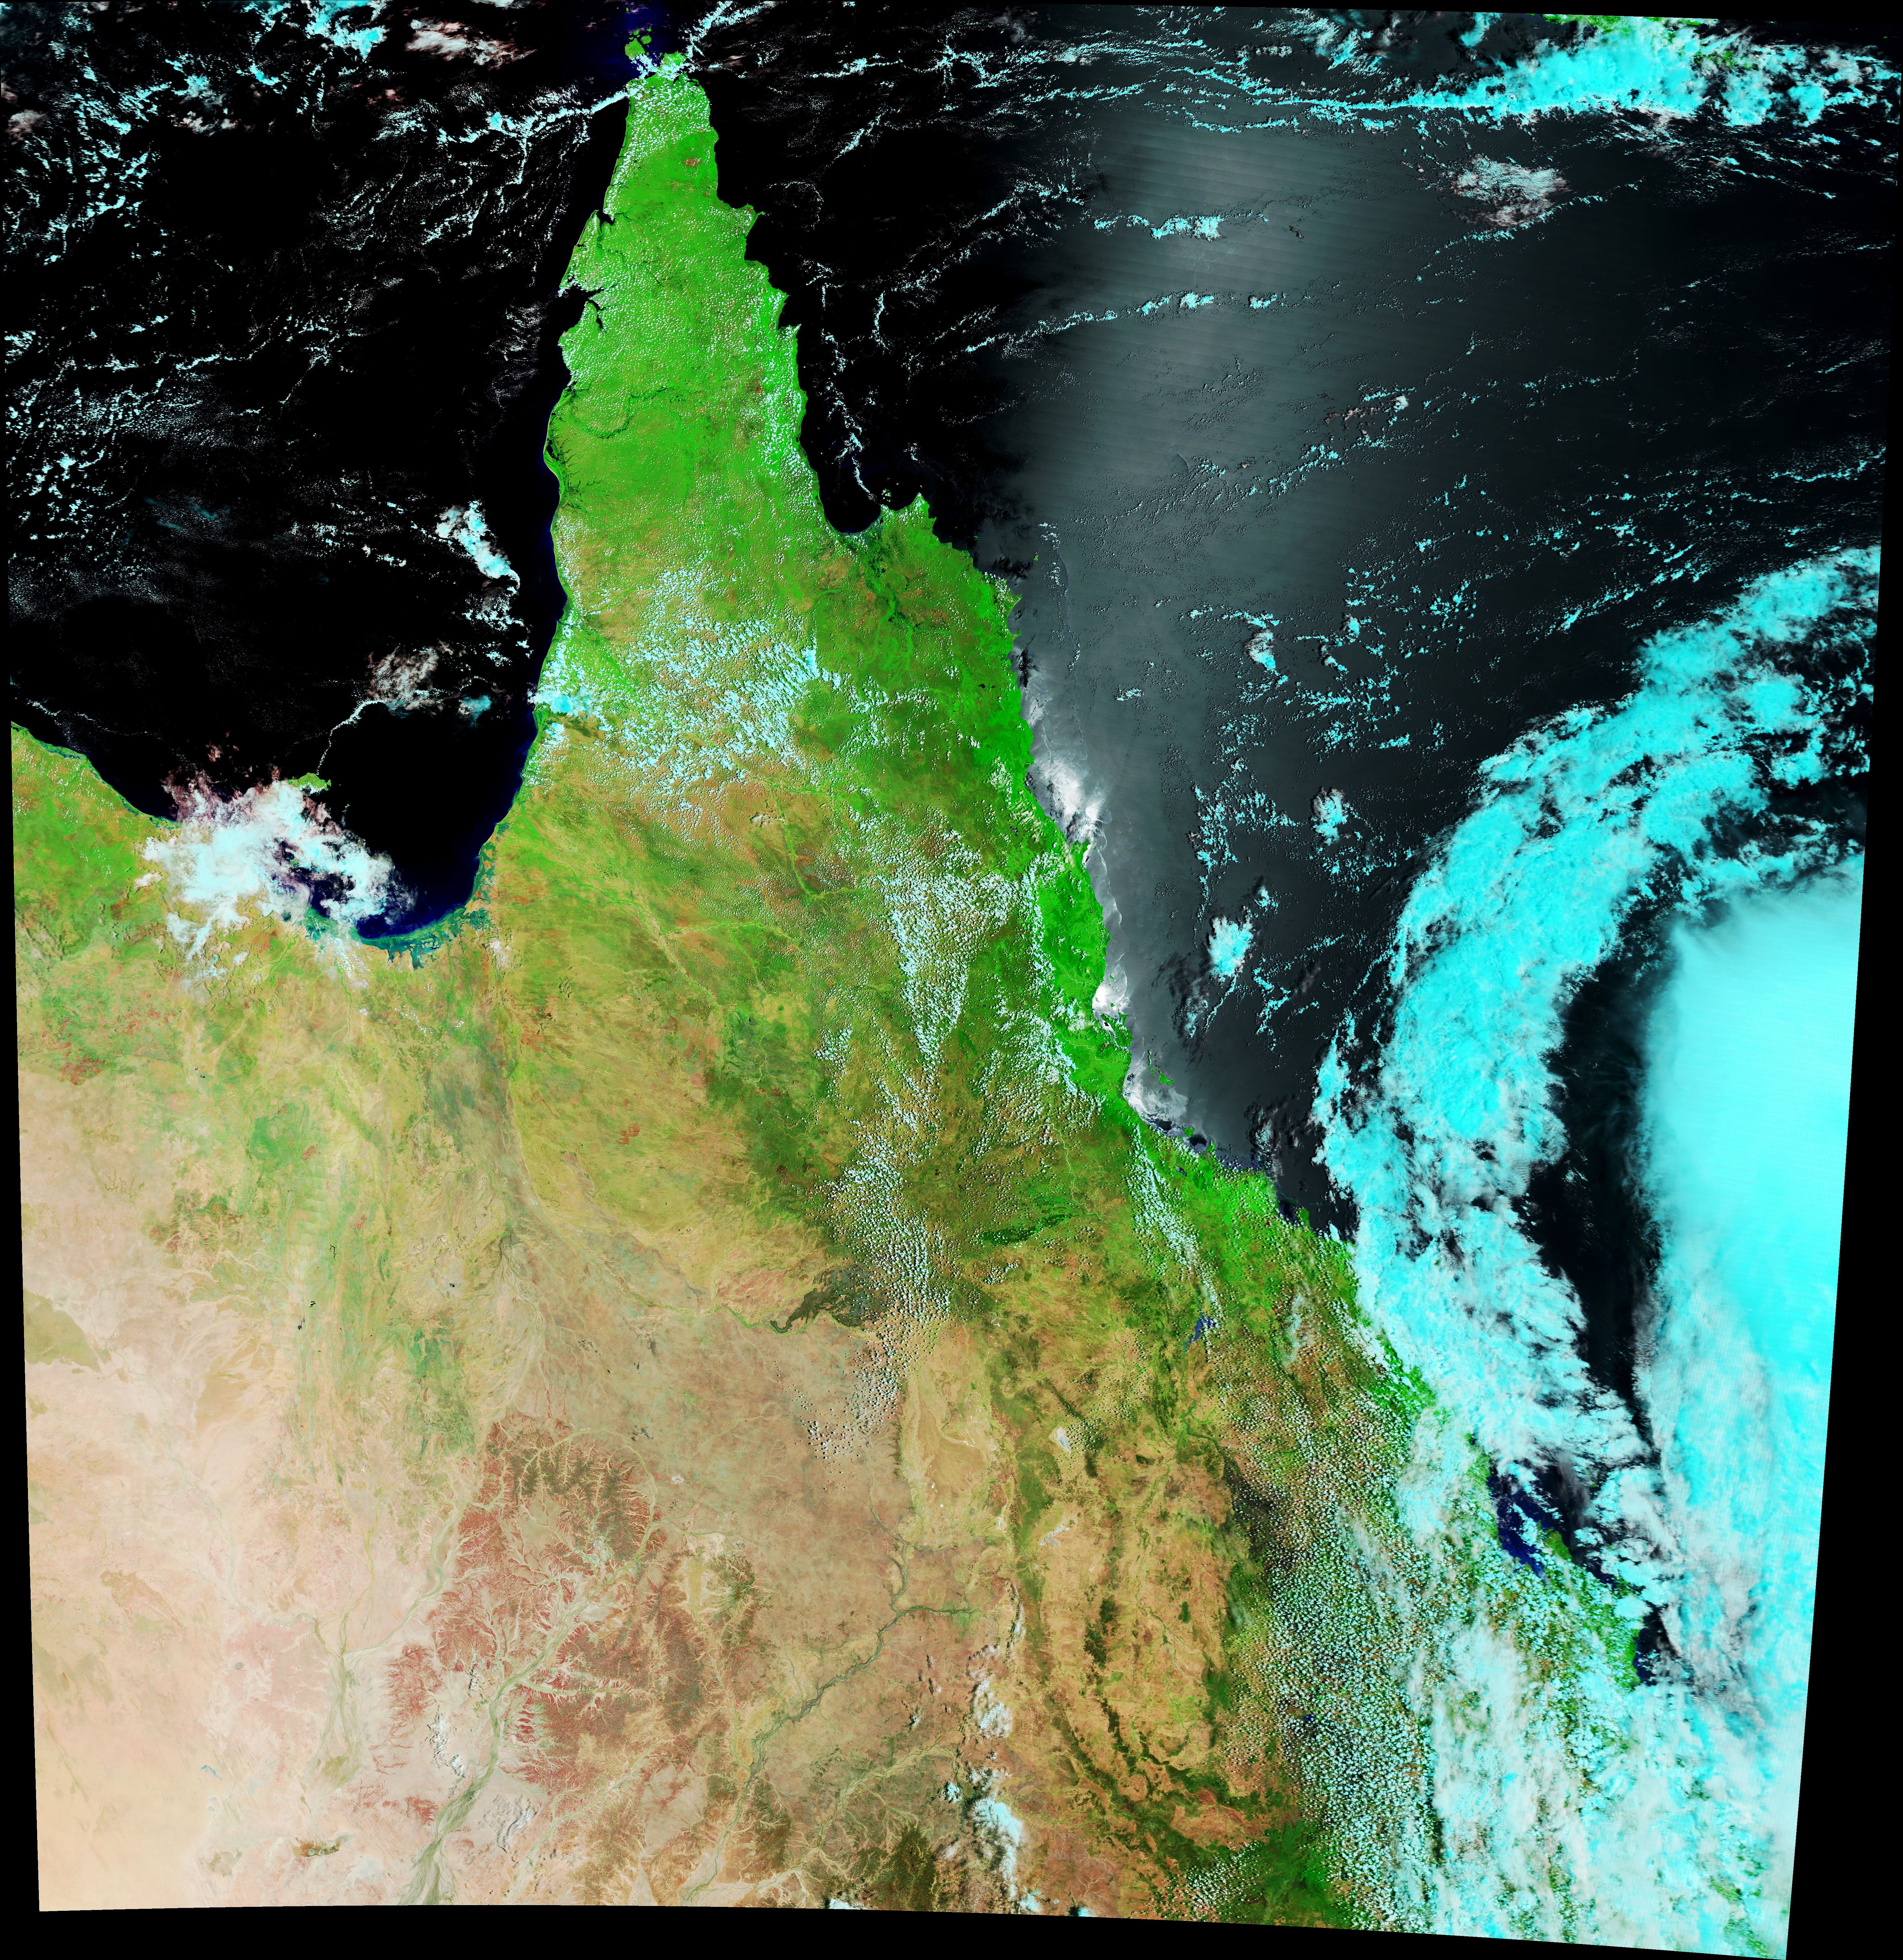
The flood waters also inundated areas to the east, including Townsville. Water storage levels behind the Ross River Dam rose to more than double its capacity, spurring authorities to open spillway gates. The release added to the flooding of several Townsville suburbs along the Ross River and prompted hundreds of people to evacuate. Southeast of Townsville, muddy, sediment-laden waters drained from the Burdekin River into the Coral Sea.
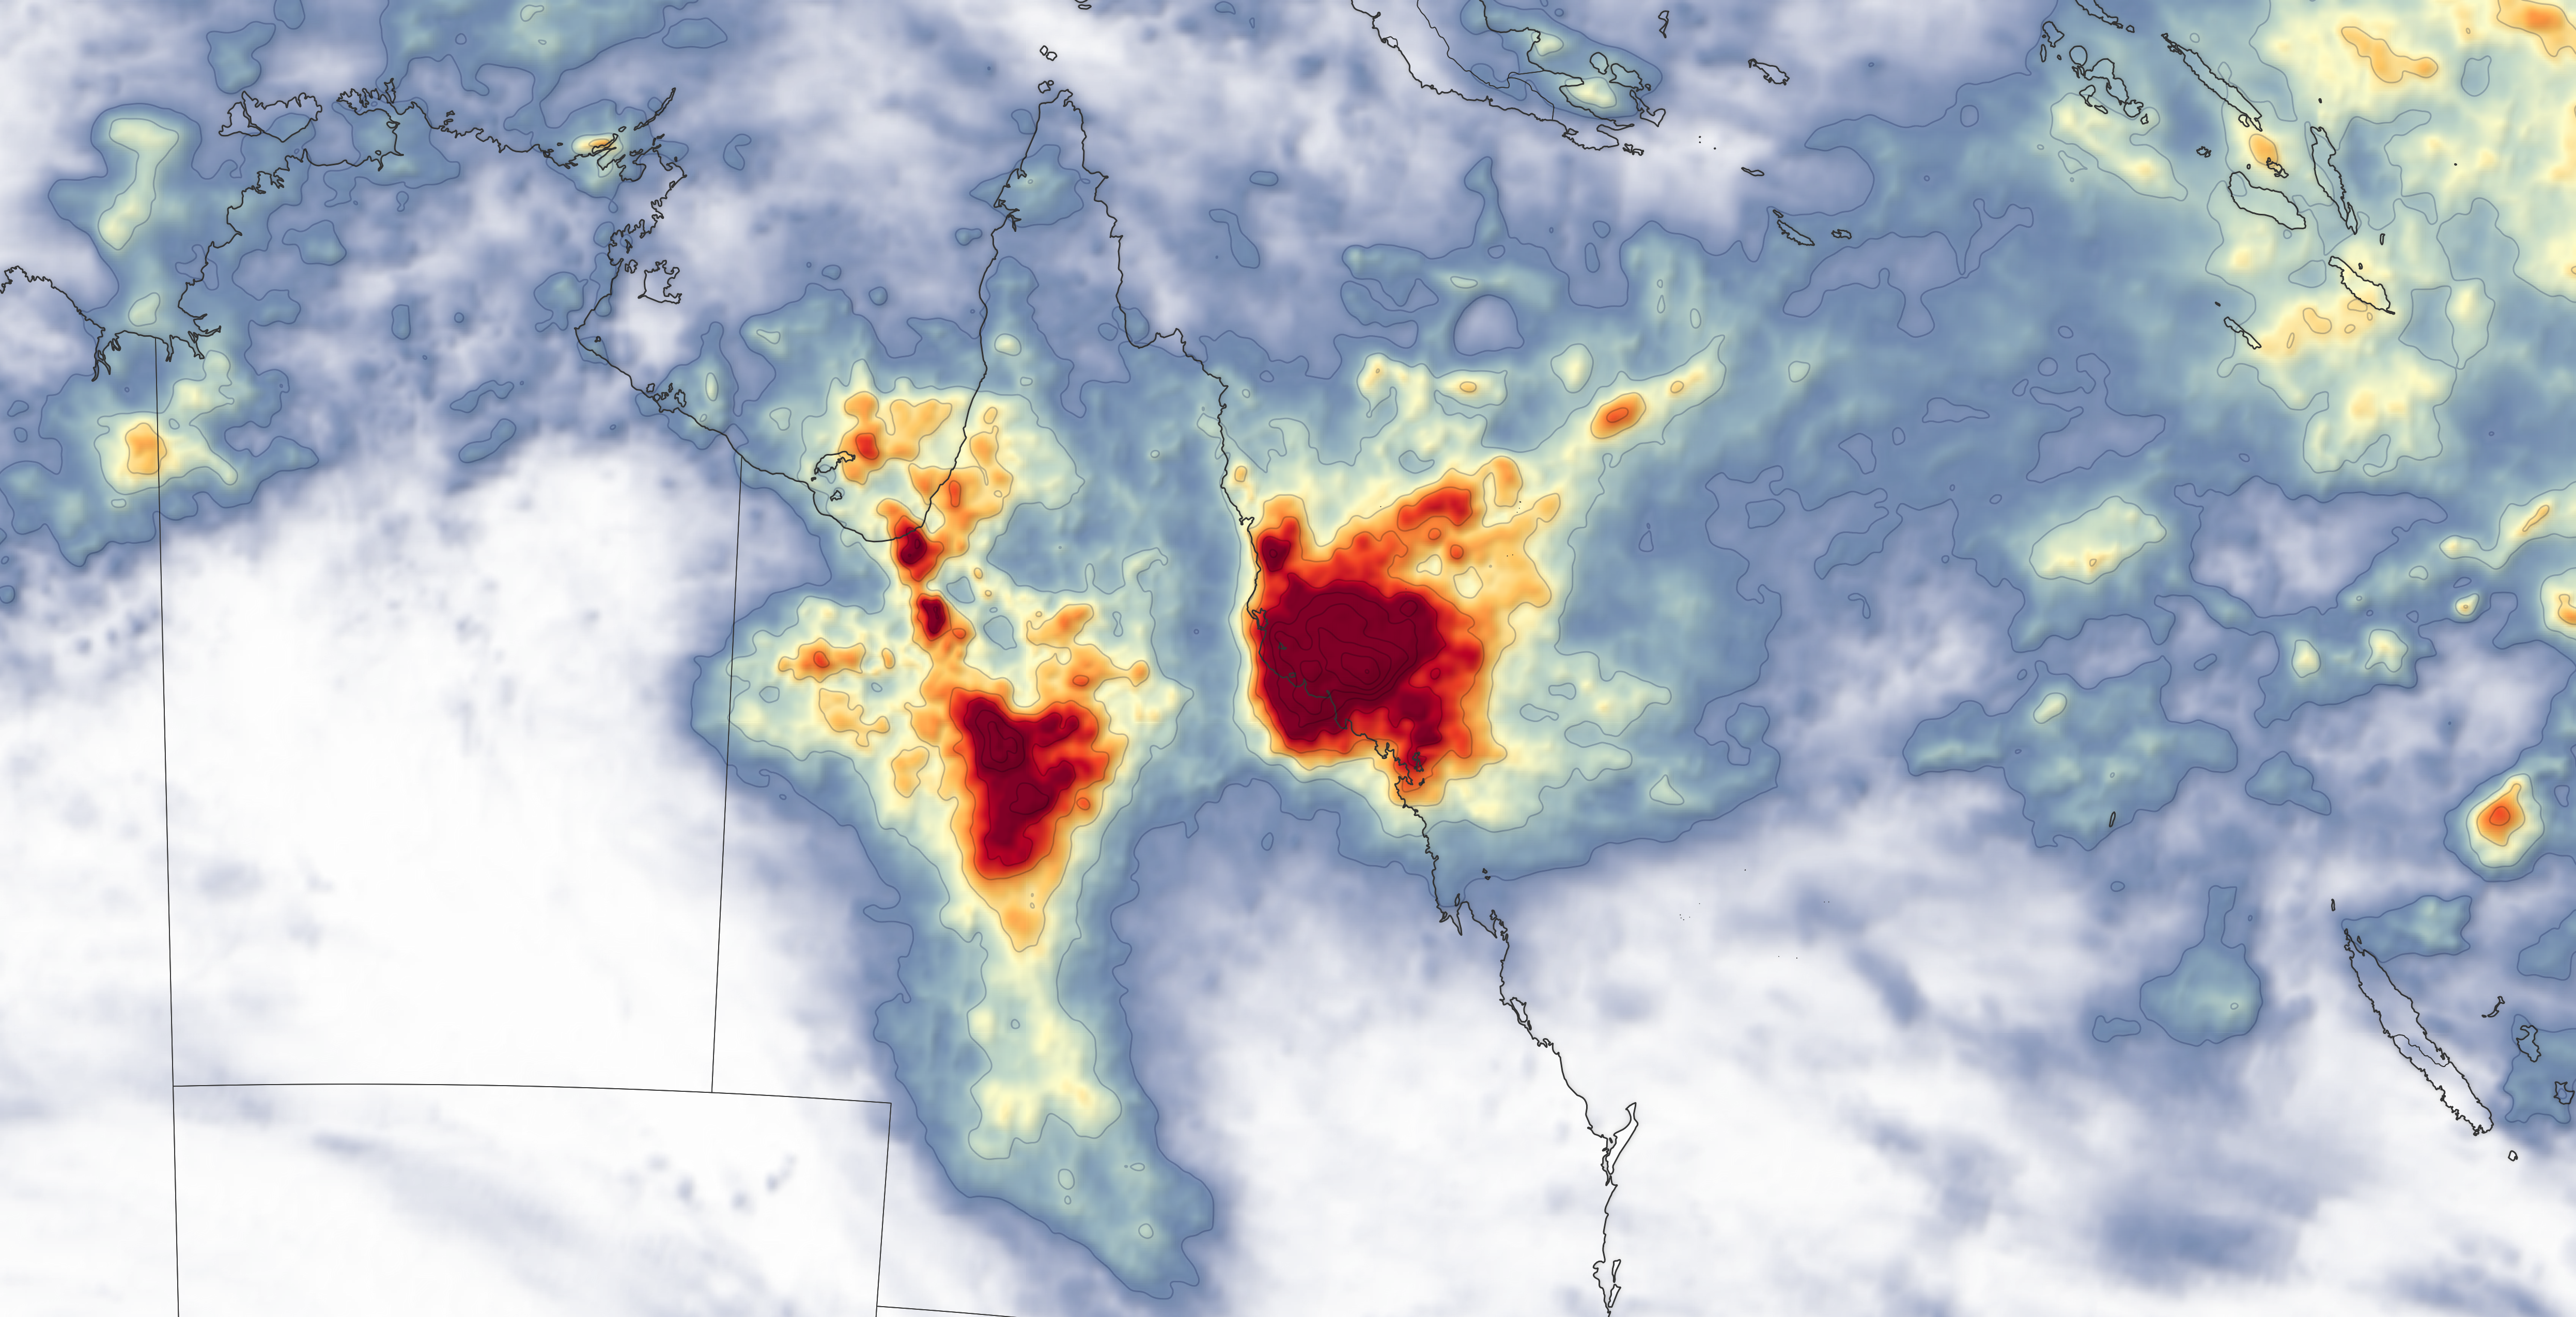
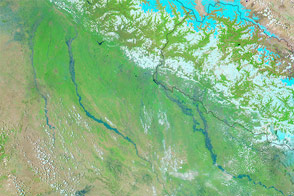
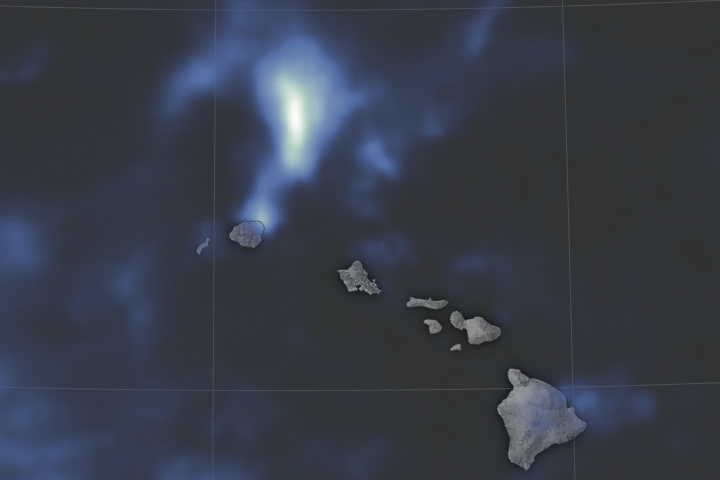
The map above shows the tremendous amount of rain that fell around the Mount Isa and Townsville areas from January 27 to February 10—as much as 55 centimeters (22 inches) in places. These rainfall data are remotely-sensed estimates that come from the Integrated Multi-Satellite Retrievals (IMERG), a product of the Global Precipitation Measurement (GPM) mission. The GPM satellite is the core of a rainfall observatory that includes measurements from NASA, the Japan Aerospace Exploration Agency, and five other national and international partners. Local rainfall amounts can be significantly higher when measured from the ground. Check out this map from the Australian Bureau of Meteorology to see weekly rainfall totals across the country.
NASA Earth Observatory images by Joshua Stevens, using MODIS data from NASA EOSDIS/LANCE and GIBS/Worldview and IMERG data from the Global Precipitation Mission (GPM) at NASA/GSFC. Story by Kathryn Hansen.


