
 | |||
From 93 million miles away, the churning ball of gas that is our Sun seems little more dynamic than a light bulb—a steady, always-on, really powerful light bulb. Sure, in the winter it seems dimmer and less likely to linger in the sky, but somewhere in middle school or junior high, we learn that it’s not the Sun that changes, but the Earth. As the planet circles the Sun, the tilt in Earth’s axis tips one hemisphere toward the Sun and the other away. The seasons may change, but the Sun does not. A closer inspection, however, reveals that the Sun is more variable than our everyday experience would lead us to believe. Since the 1600s European astronomers have kept track of dark spots that emerge and travel across the surface of the Sun, and then fade over days, weeks, or months. These sunspots are accompanied by smaller bright areas called faculae. Driven by a dynamo beneath the Sun’s surface, these magnetic features rise and fall over an 11-year cycle. Times of increased sunspot activity are called solar maximums, and quieter times are called minimums. In their continued effort to understand the Sun, solar physicists of the 21st century are using satellites to observe the amount of energy reaching the Earth and how it changes. |
| ||
 | |||
Not surprisingly, the subject is controversial. After all, the energy from the Sun is the fundamental driving force of climate. As people around the world struggle to make difficult decisions in the face of climate change, any evidence that the Sun could have something to do with global warming might encourage us to scale back our efforts to reduce greenhouse gases. Then again, in the face of something we can’t control, controlling what we can might become more important. With so many social, environmental, and economic decisions depending on climate change research, it’s no wonder that interpreting the satellite observations of the Sun’s brightness has become so controversial. |
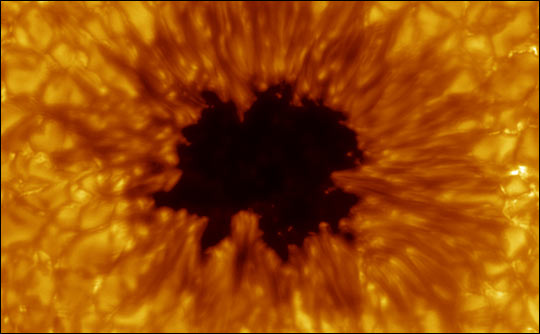
The sun, once assumed to be perfect and unchanging, was first shown to be variable with the discovery of sunspots in 1610. The number of these dark, turbulent regions increases during times of high solar activity, when the sun emits more energy than normal. (Image courtesy the Royal Swedish Academy of Sciences Institute for Solar Physics) | ||
 |
| ||
On one side of the controversy is the work of solar physicist Richard Willson of Columbia University in New York. Willson is the principal scientific investigator for a series of NASA satellite sensors called Active Cavity Radiometer Irradiance Monitors (ACRIM) whose observations of the total amount of solar radiation reaching the outskirts of the Earth’s atmosphere, called total solar irradiance, span much of the last two decades: ACRIM1 from 1980-1989, ACRIM2 from 1991-2001, and ACRIM3, from 2000 to the present. Willson says his work with ACRIM and a handful of other sensors shows not only that the total solar irradiance varies over the 11-year solar cycle, but that it has crept upward between the last two solar minimums. It’s this latter claim that has sparked disagreement within the solar research community. |
Continuous records of sunspots go back more than 250 years, providing a history of solar activity. These records reveal the 11-year solar cycle, when the sun’s energy output rises and falls. Sunspots alone, however, don’t reveal exactly how much energy is emitted by the sun. To measure total solar irradiance, scientists must use satellite sensors, which are above the Earth’s atmosphere. (Graph by Robert Simmon, based on data from the National Geophysical Data Center) | ||