The Earth Observatory has published its last Image of the Day on this website. Please join us on our new home at science.nasa.gov/earth/earth-observatory.
A Record from the Deep: Fossil Chemistry | |||
The most valuable fossils found in sediment cores are from tiny animals with a calcium carbonate shell, called foraminifera. One species of foraminifera lives in the icy waters of the Arctic above Iceland and near Antarctica. When McManus and other scientists began to uncover a large number of fossils of polar foraminifera in cores collected off the coast of Great Britain as part of an ongoing research project, they knew that the waters there had once been much colder. Once the fossils had been dated, they told scientists when the ocean had been icy cold. By finding cold-water foraminifera of the same age elsewhere in the oceans, scientists can construct maps showing where cold water existed at various points in the Earth’s history. |
| ||
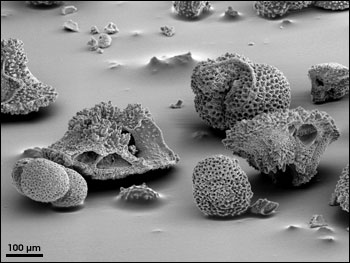
The microfossils themselves can speak volumes about the chemistry and temperature of the ocean. The calcium carbonate shells of foraminifera and coccoliths (their plant counterparts), and the silicon dioxide shells of radiolarians (animals) and diatoms (tiny plants) all contain oxygen. Oxygen in sea water comes in two important varieties for paleoclimate research: heavy and light. The ratio of these different types of oxygen in the shells can reveal how cold the ocean was and how much ice existed at the time the shell formed. In general, the shells contain more heavy oxygen when ocean waters are cold and ice covers the Earth. [For details, see The Oxygen Balance.] Wind and Water CurrentsA large deposit of microfossils of plants and animals can also tell scientists about ocean currents and wind patterns. Ocean plants and animals use the nutrients at the surface of the ocean, die, and then carry the nutrients with them as they sink to the sea floor. In some regions, strong ocean currents sweep nutrients up from the bottom to feed a thriving population. Called upwelling, the phenomenon drives plant and animal populations up until the nutrients are all used, and the microscopic plants and animals die. A small plant called a diatom takes particular advantage of upwelling. Ocean cores hint at patterns of upwelling when one contains a particularly thick layer of microfossils, especially diatoms, from the same time. Since upwelling currents are largely driven by the wind, these patterns also tell scientists something about wind and weather patterns. |
Foraminifera skeletons found in sediment cores provide scientists a means to date cores. Fossils also contain information about ocean temperature, chemistry, currents, and surface winds. (Micrograph copyright Eric Condliffe, University of Leeds Electron Optics Image Laboratory) | ||
 |
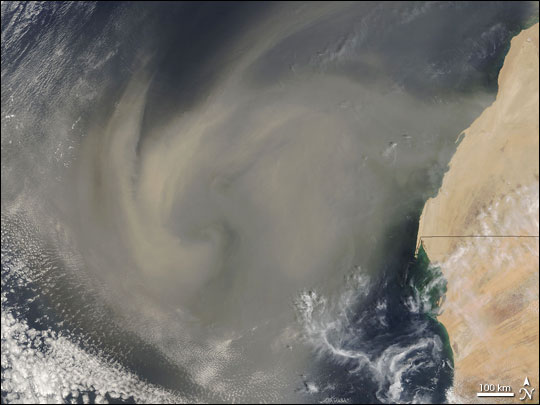
Dust in ocean cores can reveal weather and current patterns. Today, great plumes of Saharan dust snake their way across the Atlantic to the American continents. Dust blows into the Pacific from Asia’s vast interior deserts. When the dust shows up in ocean cores, scientists can analyze its chemistry to determine where it came from. By charting the distribution of the dust, scientists can see where the winds were blowing and how strong they were. The dust also gives scientists a glimpse into how dry and dusty the climate may have been at a particular time. |
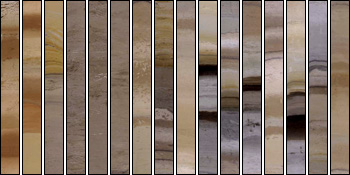
This image sequence shows the cross-section of a core drilled in the Mediterranean Sea. Sediment layers can be formed from dust, volcanic ash, river sediments, underwater mudslides, plant and animal skeletons, precipitated calcium carbonate, or salts left behind by an evaporated sea. (Image courtesy Integrated Ocean Drilling Program) | |
 | |||
Bits of continental dust can be swept into the ocean by rivers as well as the wind. The dust’s location on the ocean floor as well as the mineral content of the dust give scientists clues about where the dust came from and how it arrived at its final location on the ocean floor. For example, dust in the middle of the Pacific Ocean is more likely to have been carried on the wind than deposited by rivers. Sediment made up of mineral grains from the continents can also tell about ocean currents. After the sediment is dumped in the ocean by the wind or rivers, it is swept on currents to its final resting place on the ocean floor. The distribution of the mineral grains can reveal how strong the currents were and where they flowed. Currents also carry icebergs from their point of origin toward the equator where the ice melts. Rocks and soil embedded in the icebergs sink to the ocean floor and later show up in ocean sediment cores. Their final location tells scientists where currents once flowed, and, indirectly, where water warm enough to melt the ice existed. Ocean cores proved invaluable as scientists built a picture of the Ice Age Earth. They provided a record of a large part of the Earth stretching back millions of years, showing large patterns of climate change. In a project called Climate: Long-Range Investigation, Mapping, and Prediction (CLIMAP) in the 1970s, sea cores allowed scientists to reconstruct the climate of the Earth in the last Ice Age 20,000 years ago. “It’s still one of the major successes of the deep sea,” says McManus. “Even today, it serves as the focus of new studies.” |
Wind can transport dust grains thousands of miles from the interior of a continent out into the open ocean. Dust in sediment cores can indicate the direction of prevailing winds and conditions on land far from the core’s location. (NASA Image courtesy Jeff Schmaltz, MODIS Land Rapid Response Team) | ||
Though ocean sediment cores are immensely valuable for tracking climate over most of the Earth, they do not give scientists a picture of year-to-year change. For that, scientists look at information preserved in the ice sheets of Greenland and Antarctica. The next installment in this series will describe how scientists use ice cores to understand year-to-year variation in Earth’s past climate.
|
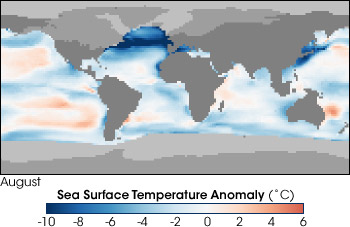
The CLIMAP project developed maps of sea surface temperatures during the peak of the last Ice Age based on ocean and lake sediment cores. This map shows the difference in temperatures between then and now (blue areas were colder, red areas warmer). One interesting feature is the presence of much colder water in the North Atlantic—evidence that the Gulf Stream Current has shifted in the past. (NASA Image by Robert Simmon, based on CLIMAP 18K data archived at the NOAA National Geophysical Data Center) | ||
