


Turkmenistan's Darvaza Crater continues to burn decades after a drilling operation caused it to collapse. The fires were initially set to prevent excess natural gas from leaking. (Photo by NMK Photography, adapted under a Creative Commons license)
For a chemical compound that shows up nearly everywhere on the planet, methane still surprises us. It is one of the most potent greenhouse gases, and yet the reasons for why and where it shows up are often a mystery. What we know for sure is that a lot more methane (CH4) has made its way into the atmosphere since the beginning of the Industrial Revolution. Less understood is why the ebb and flow of this gas has changed in recent decades.
You can find the odorless, transparent gas miles below Earth’s surface and miles above it. Methane bubbles up from swamps and rivers, belches from volcanoes, rises from wildfires, and seeps from the guts of cows and termites (where is it made by microbes). Human settlements are awash with the gas. Methane leaks silently from natural gas and oil wells and pipelines, as well as coal mines. It stews in landfills, sewage treatment plants, and rice paddies.
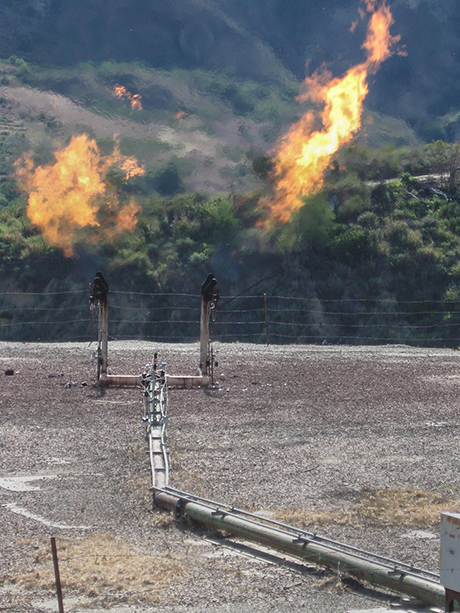
Excess natural gas is burned in a process called flaring. Flaring is done to prevent pressures at wellheads from rising to unsafe levels, and to burn off extra gas that cannot be captured while the plant is not operational. (Photo by sirdle, used under a Creative Commons License.)
In recent years, the gas has started to turn up in some surprising places. Nighttime satellite images show points of light—some of them gas flares—in rural parts of North Dakota, Texas, and Colorado. Mysterious craters venting methane have appeared in Siberia’s Yamal Peninsula. In October 2014, scientists announced they had discovered satellite signals of a methane hotspot over the Four Corners region of the United States. Radar observations have shown bubbles of methane rising from the depths of the Arctic Ocean. And eye-popping videos on the Internet show scientists lighting methane-rich Alaskan lakes on fire.
The long-term, global trend for atmospheric methane is clear. The concentration of the gas was relatively steady for hundreds of thousands of years, but then started to increase rapidly around 1750. The reason is simple: increasing human populations since the Industrial Revolution have meant more agriculture, more waste, and more fossil fuel production. Over the same period, emissions from natural sources have stayed about the same.
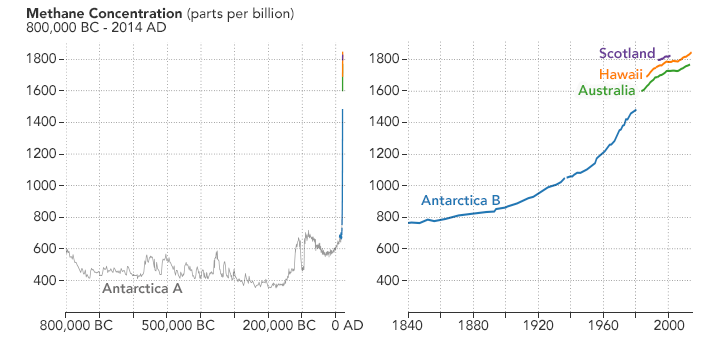
A combination of historical ice core data and air monitoring instruments reveals a consistent trend: global atmospheric methane concentrations have risen sharply in the past 2000 years. (NASA Earth Observatory image by Joshua Stevens, using data from the EPA.)
But if you focus on just the past five decades—when modern scientific tools have been available to detect atmospheric methane—there have been fluctuations in methane levels that are harder to explain. Since 2007, methane has been on the rise, and no one is quite sure why. Some scientists think tropical wetlands have gotten a bit wetter and are releasing more gas. Others point to the natural gas fracking boom in North America and its sometimes leaky infrastructure. Others wonder if changes in agriculture may be playing a role.
“There is no question that methane is doing some very odd and worrying things,” said Euan Nisbet, an atmospheric scientist at Royal Holloway, University of London. The big question is why. Scientists wonder if they will have the right monitoring systems in place to answer that question adequately.
The stakes are high. Global temperatures in 2014 and 2015 were warmer than at any other time in the modern temperature record, which dates back to 1880. The most recent decade was the warmest on the record. And carbon emissions are central to that rise.

Both 2014 and 2015 set records for the warmest temperatures recorded globally. The long term trend also shows that El Niño years are typically warmer than other years. (NASA Earth Observatory image by Joshua Stevens, using data from the NASA Goddard Institute for Space Studies.)
Methane makes up just 0.00018 percent of the atmosphere, compared to 0.039 percent for carbon dioxide. (CO2 is roughly 200 times more abundant.) Yet scientists attribute about one-sixth of recent global warming to methane emissions; what methane lacks in volume it makes up for in potency. Over a 20-year period, one ton of methane has a global warming potential that is 84 to 87 times greater than carbon dioxide. Over a century, that warming potential is 28 to 36 times greater. The difference occurs because methane is mostly scrubbed out of the air by chemical reactions within about ten years, while carbon dioxide persists in the atmosphere for much longer than a century.
“That means the climate effects of methane are front-loaded,” explained Drew Shindell, a climate scientist at Duke University. “Part of the reason there is so much interest in methane right now is because reducing those emissions could slow warming over the next few decades. This does not let us off the hook for reducing carbon dioxide, but the benefits of carbon dioxide reductions will come much later.”
Christian Frankenberg has spent much of his career trying to use satellites to observe methane. He began his research as a postgraduate scientist at Heidelberg University (Germany), where he focused on interpreting observations made by the Scanning Imaging Absorption Spectrometer for Atmospheric Chartography (SCIAMACHY), an imaging spectrometer on the European Space Agency’s Envisat satellite. By analyzing the spectra of infrared light reflected by Earth’s surface, Frankenberg and colleagues were able to map methane concentrations on a global scale.
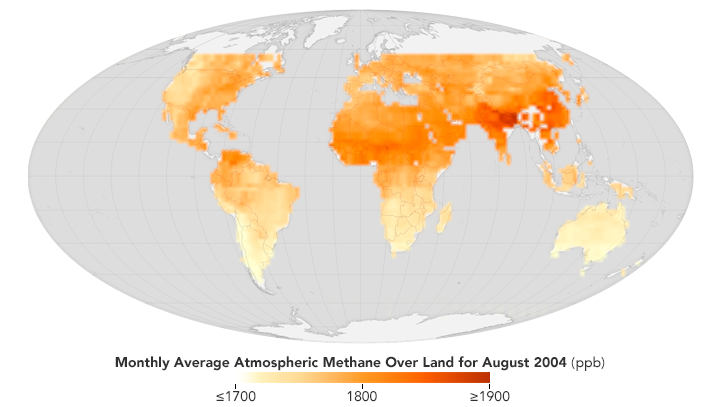
Before ending operation in 2012, SCIAMACHY data provided scientists with frequent access to methane measurements, shown here at a resolution of about 250km per pixel. (NASA Earth Observatory map by Joshua Stevens, using SCIAMACHY data from the Tropospheric Emission Monitoring Internet Service.)
In 2011, Frankenberg and colleagues published their maps, showing average methane concentrations around the world between 2003 and 2009. The maps revealed notable variations and hot spots that were not obvious from ground-based measurements or aircraft surveys. For instance, the Sichuan Basin—a low-elevation, fertile area in southwestern China—had the highest concentrations of methane in the world. The region has an active natural gas industry, and it is also dense with rice paddies and animal farms. The Indo-Gangetic plain, northern Thailand, and eastern China—all major farming areas in Asia—also scored high for methane, while the arid Tibetan Plateau had unusually low levels. In Africa, the swampy Sudd wetlands of southern Sudan had the highest concentrations, while the fertile Fergana Valley in Uzbekistan stood out in central Asia.
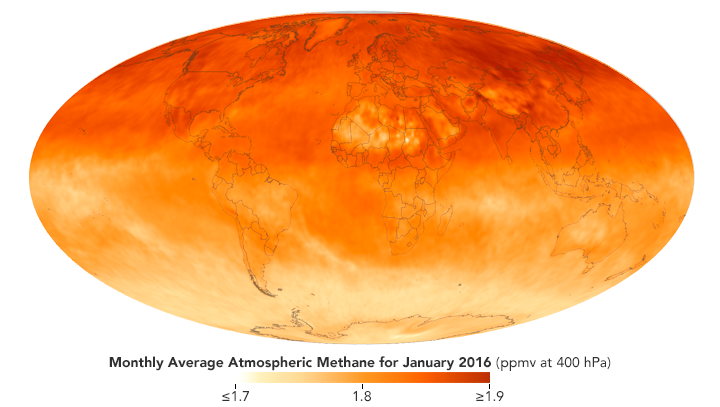
Although Envisat—the satellite carrying SCIAMACHY— is no longer operational, other systems continue to monitor atmospheric methane. The Atmospheric Infrared Sounder (AIRS) aboard NASA’s Aqua satellite has been in operation since 2002. (NASA Earth Observatory map by Joshua Stevens, using AIRS data.)
“It is obvious from the global data that understanding what is happening in wetlands, especially tropical wetlands, is critical to understanding global trends,” said Frankenberg, who is now based at the Jet Propulsion Laboratory. “Unfortunately, these same areas in Africa, Asia, and South America are some of the places where ground-based sensor networks are lacking and cloud cover is the most problematic for satellites.”
Another area that stood out in the SCIAMACHY data was the San Juan Basin in the Four Corners region of the western United States. While the area is known for having active gas, coal, and oil industries, nobody expected to find as much methane as the satellite did. SCIAMACHY observed a methane cloud about the size of Delaware; it was the largest methane hot spot in North America to be detected by a satellite. By plugging the SCIAMACHY observations into computer simulations of the atmosphere, researchers estimated the area was emitting about 0.59 teragrams of methane per year—an amount equivalent to all of the methane emissions from the oil, gas, and coal industries in the United Kingdom for a year.
“Nobody thought to look at the Four Corners until the SCIAMACHY data came out,” said Eric Kort, a scientist from the University of Michigan and lead author of a study describing the anomaly. “The satellite could only give us a broad overview, as SCIAMACHY does not have the resolution to tell us where the methane was coming from. For that degree of detail, you need airplane and ground observations.”
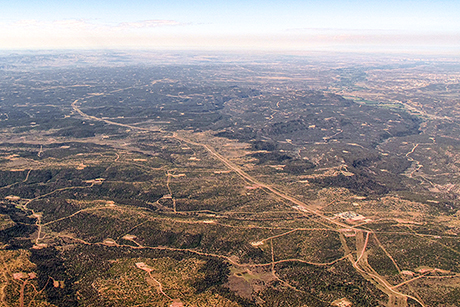
Drilling pads dot the landscape of the Four Corners region of the southwestern United States. (Photo taken August 10, 2010 by EcoFlight.)
To pinpoint the sources, the National Oceanic and Atmospheric Administration (NOAA) organized the Twin Otter Projects Defining Oil Well and Natural gas emissions (TOPDOWN) field campaign in April 2015. Dozens of scientists from the University of Colorado, the University of Michigan, NASA, and NOAA deployed methane sensors on airplanes and roving vans with the goal of finding the sources of the hot spot. At the same time, the operators of Japan’s Greenhouse Gases Observing Satellite (GOSAT) pointed a sensor toward Four Corners in order to observe the methane emissions from space.
Preliminary analyses suggest fossil fuel extraction is probably a key source of the methane. (TOPDOWN researchers plan to release detailed results sometime in 2016.) In the meantime, Kort cautions that natural factors, such as the topography and wind patterns, also play an important role in causing hot spots to show up in the SCIAMACHY data.
“Remember that this is a map of methane anomalies and not a map of methane emissions. That is an important distinction, as the signals are a combination of emissions and wind patterns,” said Kort. “Imagine a case where you have high emissions, but persistent high winds. This would not produce a large signal as the methane will be more distributed.”
According to Kort, the SCIAMACHY observations indicate that horizontal drilling and high-volume hydraulic fracking—technologies driving a shale gas and oil boom over the past decade—were not the source of the Four Corners methane. The satellite observations were acquired between 2003 and 2009, before fracking shale was common. The extraction of coal bed methane (natural gas trapped in pores and cracks within coal seams) is a much more likely explanation. The San Juan Basin has the largest coal-bed methane production field in the United States.
“TOPDOWN offers a perfect example of the approach the scientific community needs to take to understand why methane concentrations are on the rise,” said Frankenberg. “Satellites can give us crucial clues and point us in the right direction, but they always need to be supplemented with aircraft and ground measurements to ensure that we are interpreting their observations correctly.”
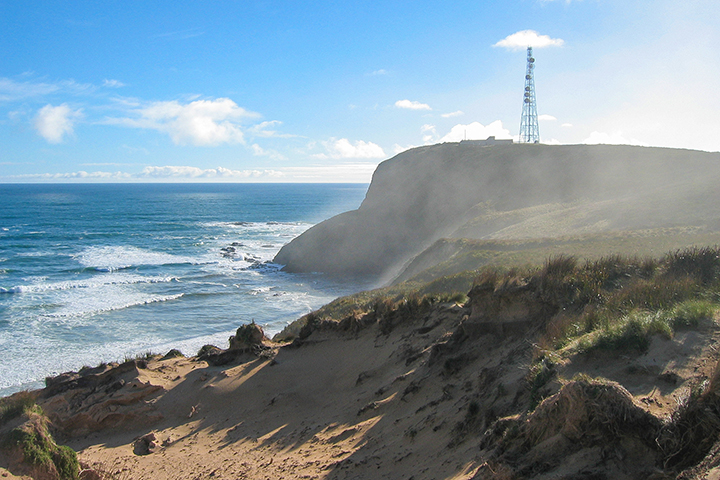
The Cape Grim Global Atmosphere Watch station, located on the western coast of Tasmania, monitors air quality. It is one of several stations that helps scientists assemble a global picture of atmospheric aerosols and pollutants. (Photo by the World Meteorological Organization, used under a Creative Commons license.)
Since 1967, NOAA has coordinated the Cooperative Air Sampling Network, an international network of ground sensors that monitor the composition of the atmosphere. At about 50 sites around the world, researchers collect air samples in flasks each week and send them to Colorado for detailed analysis. Since 1978, several institutions including NASA have separately maintained the Advanced Global Atmospheric Gases Experiment (AGAGE), which makes similar measurements. Although the networks have a limited number of stations and an uneven distribution, the stations are sufficient to estimate global methane concentrations because methane mixes into the atmosphere rapidly.
According to the record from these ground stations, those concentrations have changed in ways that have intrigued and puzzled scientists. In 1985, the average concentration was 1,620 parts per billion (ppb). By 2015, it had increased to 1,800 ppb. (Before the Industrial Revolution, concentrations held steady at about 700 ppb.) But the rate of increase in recent decades has varied. From the 1980s until 1992, methane was rising about 12 ppb per year. Then came roughly a decade of slower growth at 3 ppb per year. Between 2000 and 2007, atmospheric methane concentrations stabilized. Starting in 2007, they began to rise again and have continued to do so since, increasing at a rate of 6 ppb per year.
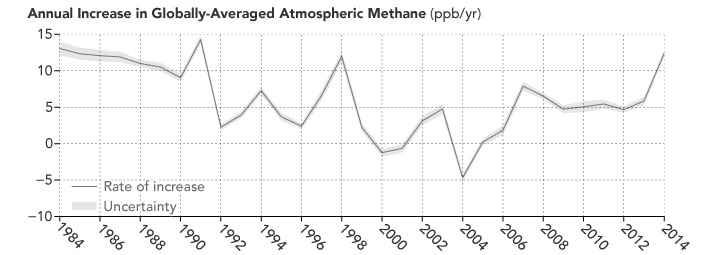
Atmospheric methane has continued to increase, though the rate of the increase has varied considerably over time and puzzled experts. (NASA Earth Observatory image by Joshua Stevens, using data from NOAA.)
Most experts agree on the cause of the slowdown in the 1990s. They attribute it to drier conditions in the tropics, along with a decrease in fossil fuel use and agricultural emissions following the collapse of the former Soviet Union.
The cause of the recent increase remains a topic of study and debate, explained Ed Dlugokencky, a NOAA scientist who leads a team monitoring methane trends. There are hints that increased fossil fuel emissions in North America and increasing emissions from tropical wetlands could be playing important roles, but the details are muddled.
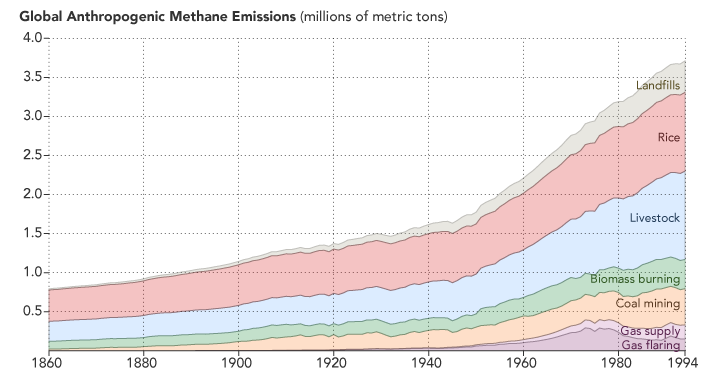
Methane emissions related to human activity are on the rise. (NASA Earth Observatory image by Joshua Stevens, using data from CDIAC.)
Scientists hope that a new network of sensors will be able to decipher the distinct chemical fingerprints of different methane sources. When methane has more neutrons in its chemical structure, it is said to be a “heavier” isotope; fewer neutrons make for “lighter” methane. Different processes produce different proportions of heavy and light methane. Wetlands, for instance, tend to emit methane with a lighter isotopic fingerprint that is characteristic of gas produced by microbes. A heavier isotopic fingerprint is usually associated with methane recovered with fossil fuels.
There are signs in the isotopic data that suggest agricultural sources or wetlands have contributed significantly to the increase since 2007. “The coincident timing of the methane increase and increased tropical precipitation after a transition from El Niño to La Niña, along with changing spatial patterns in our observations, are good indicators of a large contribution from tropical wetlands,” noted Dlugokencky.
However, some of the details are still disputed or fuzzy. “I have not yet seen a publication that fully explains the causes of the recent methane rise. Emissions linked to the development of new fossil-fuel sources—fracking, oil sands—must be contributing, though I have also seen measurements that suggest emissions from tropical wetlands are also increasing,” said Murat Aydin, an atmospheric chemist at the University of California, Irvine. “I expect to see this issue battled out in the scientific literature over the next several years. In the end, it might not be just one thing or another; it could be a mix of several factors.”
In nighttime satellite imagery, the light from Eagle Ford competes with nearby cities of San Antonio and Austin. The electric glow of drilling equipment and worker camps combines with flickering gas flares to create an unmistakable arc of light across southeastern Texas.
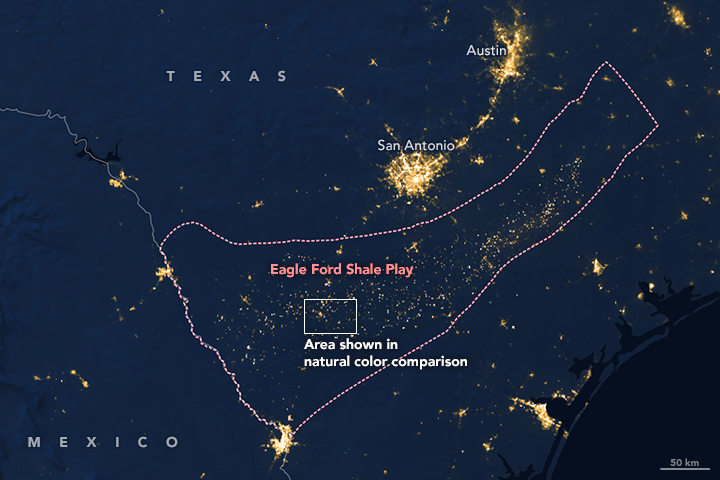
Gas flares mingle with other nighttime lights that shimmer across the Eagle Ford Shale Play in Texas. (NASA Earth Observatory map by Joshua Stevens, using data provided by NOAA.)
In daylight, the view is just as stunning. In the early 2000s, the area was sleepy scrubland. By 2010, a bustling network of roads and rectangular drill pads had completely transformed the landscape. Many of those pads are crowded with heavy machinery, a sign that they are in the midst of being hydraulically fractured or “fracked.”
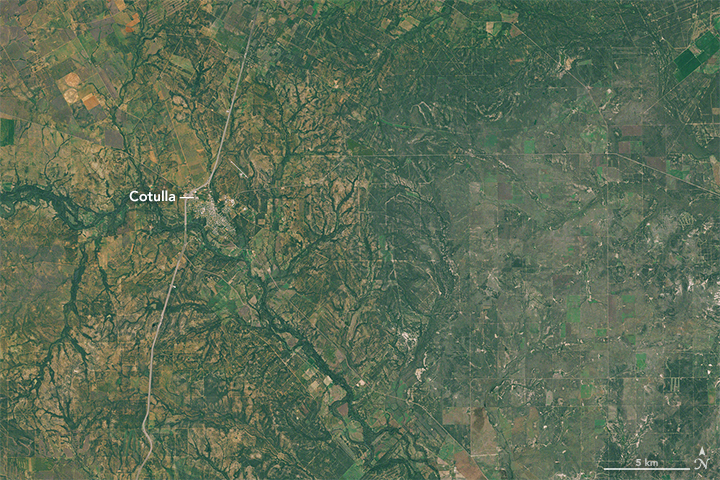
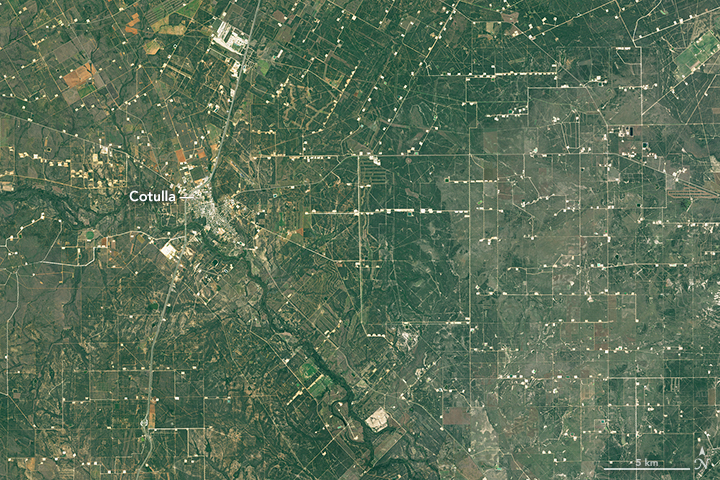
Satellite imagery reveals just how much natural gas drilling has changed the landscape within the Eagle Ford Shale Play. Use the interactive slider to compare the images. (NASA Earth Observatory images by Joshua Stevens, using Landsat data from the U.S. Geological Survey.)
While the oil and gas industry has fractured rock formations to get more oil for decades, the fracking boom in recent years has changed the game. Energy companies have recently developed techniques to drill horizontally as well as vertically into shale deposits. By pumping large volumes of water into boreholes miles below the surface, they fracture shale and liberate natural gas, which is mainly methane.
Since 2006, the contribution of coal to the U.S. energy portfolio has fallen rapidly as the consumption of energy from natural gas has increased, according to data collected by the U.S. Energy Information Agency. In April 2015, natural gas surpassed coal as the primary source of electricity (not including heating) in the United States.
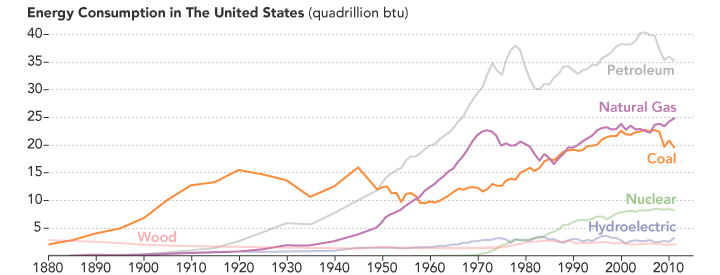
Until the early 20th century, wood and coal dominated US energy use (heating and electricity). Petroleum, followed by natural gas, quickly took over. Coal usage is currently in decline while natural gas consumption undergoes another increase. (NASA Earth Observatory image by Joshua Stevens, using data from the EIA.)
Some scientists and policymakers have argued that a shift from coal and oil to natural gas has the potential to slow down the rate of global warming because burning methane generates about half as much carbon dioxide as burning coal. In fact, natural gas boosters often speak of natural gas as a “bridge” fuel that can be used until more renewable sources—such as solar and wind—increase production.
However, other researchers such as Cornell University’s Robert Howarth have cast doubt on this idea by arguing that methane leakage might make the climate footprint of natural gas much larger than initially thought. Fossil fuel extraction and distribution processes can leak significant amounts of unburned natural gas. Some of the leakage occurs at the wellhead, when wells are first being drilled. But “downstream” leakage also occurs at gas processing facilities, pipelines, and other gas transportation and storage infrastructure. So while methane may be cleaner to burn, it is much more potent than carbon dioxide if it is released directly into the atmosphere without being burned.
In order to achieve an immediate climate benefit from natural gas, most scientists think the cumulative leakage should be no more than 3.2 percent of production. Beyond that, the extra warming caused by the leaked methane outweighs the potential benefit.
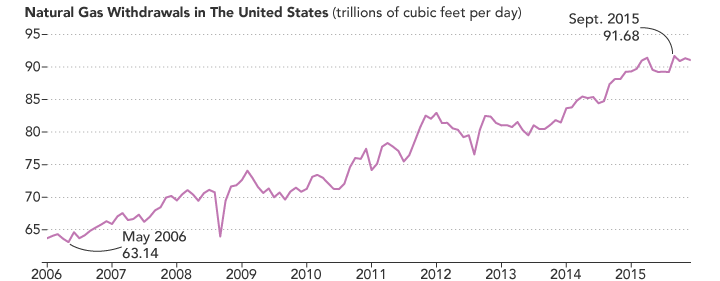
Natural gas withdrawals in the United States are increasing at the same time global atmospheric concentrations of methane are increasing. Fuel extraction is not the only reason for the rise, but scientists are working hard to figure out where and how much natural gas is leaking. (NASA Earth Observatory image by Joshua Stevens, using data from EIA.)
Determining how much methane is leaking is not straightforward, and while several research groups have attempted to pin the leak rate down, there is little consensus. Estimates from government agencies and individual researchers—based on observations from the ground, sky, and space—range from 1.5 percent to 10 percent, with the remote sensing studies generally finding higher leak rates.
Some scientists are trying to use satellites to spot leakage from fracking infrastructure. Oliver Schneising, an atmospheric scientist at the University of Bremen, analyzed SCIAMACHY data from 2006 to 2011 over the Eagle Ford and Bakken formations. Schneising and colleagues found a significant increase in the concentration of methane over both gas fields as drilling activities ramped up. Methane concentrations were so high between 2009 and 2011 that Schneising estimated the leakage rate at about 10 percent.
In 2015, Touché Howard, an environmental engineer with North Carolina-based Indaco Air Quality Services, offered a surprisingly simple explanation for why studies of leak rates based on ground-based data are so starkly different from aerial and satellite data. He asserts that a widely used ground-based sensor has a software flaw that causes it to dramatically underestimate methane emissions.
“The scientific community has made rapid progress in understanding fugitive methane emissions,” said Howarth. “We do not have the final story yet, but studies that show alarmingly high rates of emissions are turning up. Until we know more, this should give pause to anyone promoting shale gas as a bridge fuel.”
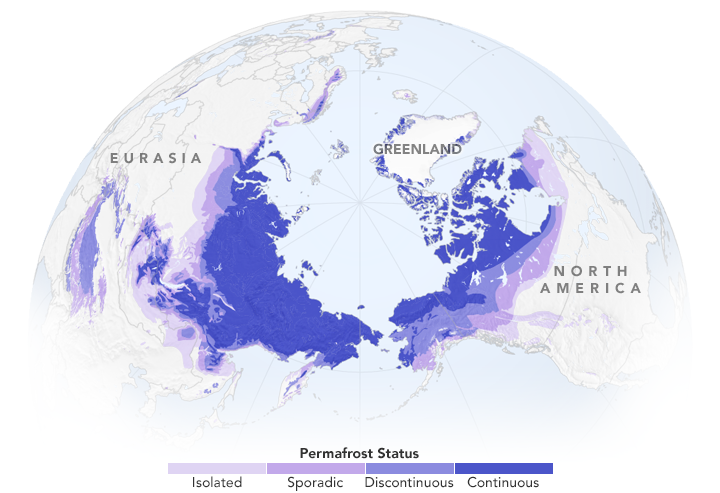
Nearly one quarter of the ice-free land in the northern hemisphere has permafrost beneath it. This amounts to 23 million square miles of permafrost. (NASA Earth Observatory map by Joshua Stevens, using data from the National Snow and Ice Data Center.)
Scientists estimate that five times as much carbon might be stored in frozen Arctic soils as have been emitted by all human activities since 1850. This worries people who study global warming. While emissions from permafrost currently account for less than 1 percent of global methane emissions, some researchers think that this could change in dramatic ways as the world warms and that carbon-rich frozen soil—permafrost—breaks down.
When permafrost gets warm enough, the soil thaws and microbial activity increases. Thawing also opens up new pathways for older stores of “geologic” methane, long-trapped by glaciers and soil layers, to leak. Both processes release extra methane into the atmosphere.
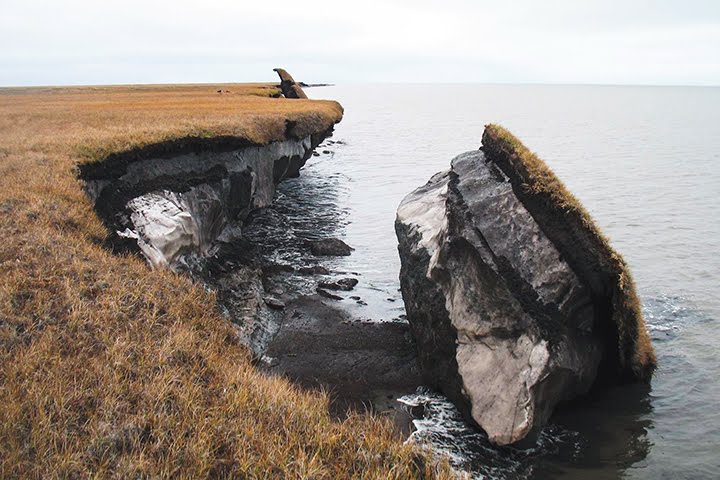
Large sections of exposed permafrost are visible after a portion of Alaska's coastal tundra collapsed. (Photo by USGS Alaska Science Center.)
Katey Walter Anthony, a hydrologist at the University of Alaska–Fairbanks, has mapped more than 150,000 methane seeps near the boundaries of thawing permafrost and receding glaciers. The seeps appear as holes in frozen lakes and rivers that, on close inspection, are bubbling with gas. Her team has found that they can actually light such seeps on fire.
The methane seeps that Anthony has found are not necessarily caused by global warming, and there is no way to know how the number today compares to the number that existed during earlier periods. But the simple existence of such seeps illustrates how methane could theoretically escape when underlying soils and waters emerge from beneath ice cover.
Professor Katey Walter Anthony discusses methane, frozen lakes, and implications for climate change. (Video by University of Alaska Fairbanks)
To date, scientists have uncovered little evidence that emissions from permafrost have increased. NOAA’s network of ground sensors has not picked up anything unusual, though the number of observing stations in the Arctic is small. No satellite has detected anything unusual either, but making observations in the Arctic is challenging due to cloud cover and limited light during winter.
To better understand current methane emissions from permafrost—and to set a baseline for monitoring future changes—NASA scientists recently outfitted a C-23 Sherpa aircraft with sensors to measure carbon dioxide and methane. Through the Carbon in Arctic Reservoirs Vulnerability Experiment (CARVE), researchers flew over northern Alaska each summer for the past four years. “We know that permafrost soils are warming even faster than Arctic air temperatures—as much as 2.7 to 4.5 degrees in just the past 30 years,” said Charles Miller, the principal investigator for CARVE. “What we do not understand well is the effect that is having on emissions of carbon dioxide and methane.”
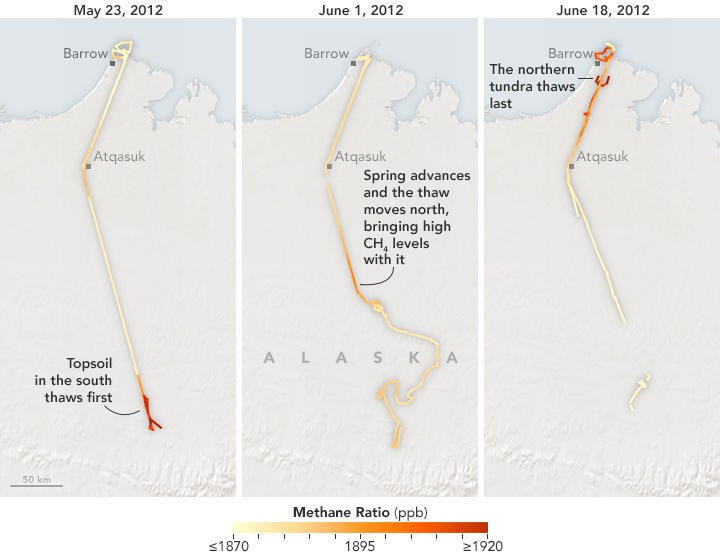
As the spring thaw advances northward across Alaska's tundra, methane is released from the topsoil. CARVE scientists observed this phenomena when bursts of high methane levels were recorded progressively northward in three separate flights. (NASA Earth Observatory map by Joshua Stevens, using data from CARVE.)
In the first year of flights (2012), the team found methane emissions to be around the expected norm for Alaska. Observations from 2013 and 2014 have not been fully analyzed and released yet, but preliminary assessments turned up some surprises. For instance, while methane emissions seemed to be at normal levels, the amount of carbon dioxide venting from the permafrost was high. The CARVE team also found evidence that Arctic regions emit methane long after surface soils freeze in the winter. Since most climate models assume virtually no Arctic methane emissions in the winter, key assumptions will need an update.
Although the CARVE campaign ended in 2015, Miller will continue the measurements through NASA’s Arctic-Boreal Vulnerability Experiment (ABOVE), which began in 2015.
There is another vast store of methane on the planet. It has been the source of doomsday scenarios and much speculation. But the facts do not live up to the dramatic scenarios.
In the cold depths of the ocean, natural gas and water can meld into ice-like mixtures known as methane clathrates or gas hydrates. These frozen gas deposits occur all over the world, mostly along the edges of continents, though the deposits can only occur under certain pressure and temperature conditions. The total volume of gas hydrates is thought to be enormous. Most estimates suggest more energy is stored underwater in gas hydrates than all other fossil fuel sources combined.
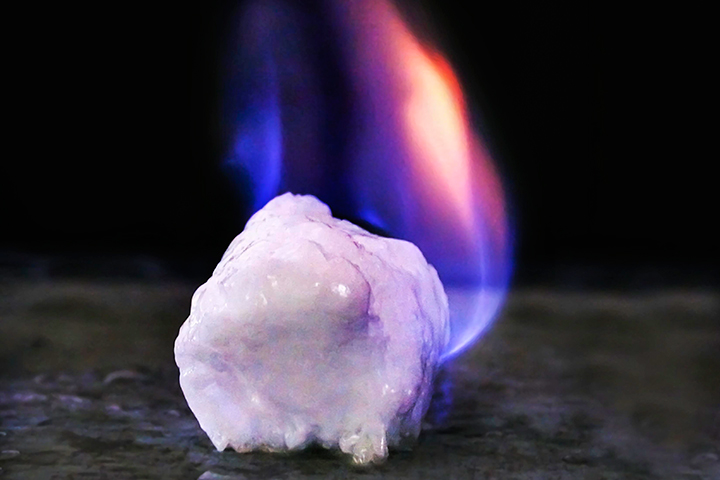
Trapped methane molecules form an ice-like solid. Known as a gas hydrate, this solid is flammable and releases methane as it burns. (Photo credit: U.S. Department of Energy)
“People tend to get very alarmed about gas hydrates because of how much methane is stored in these deposits,” said Carolyn Ruppel, chief of the U.S. Geological Survey’s gas hydrate program. “But climate change—even assuming the worst scenarios—should have little or no impact on the vast majority of it.”
Indeed most gas hydrate—about 99 percent—is sequestered in deep-water environments where temperatures are cold enough and the pressures are great enough for the deposits to remain stable. Most of these deep-water deposits lay buried beneath layers of sediment, so even if global warming continues for thousands of years, it would probably have little effect on them.
Just a small portion of gas hydrates (about 3.5 percent) occurs at depths where warming ocean waters may be causing the methane hydrate to break down, sending methane bubbling up. However, methane released underwater still rarely reaches the atmosphere directly. Microbes on the ocean floor and living within the water column usually consume it or convert it into carbon dioxide first.
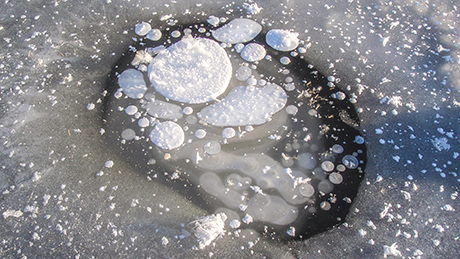
Carbon released from thawing permafrost is consumed by microbes. During this process the microbes release methane, which can form bubbles that get trapped beneath the ice. (Photo credit: USGS.)
Just 1 percent of methane hydrates are found at very shallow depths under Arctic permafrost, either on land or just offshore. On land, even the shallowest methane hydrates are still deeply buried by sediments so gas cannot escape easily. In shallow marine areas, methane hydrates could break down with warming, Ruppel notes, but deposits in this region represent such a small percentage of the overall methane hydrate stores that the climate impact would be minimal.
“We certainly will not see the catastrophic climate effect or runaway climate change from disintegrating gas hydrates that some have claimed,” said Ruppel. Rather, a more likely consequence would be a small increase in ocean acidity.
Many questions about methane remain unanswered, and the current tools limit how well they can be answered. Isotopic measurements, for instance, could be crucial for determining how much fossil fuel production is contributing to increasing methane concentrations. But the number of stations capable of collecting isotope data is quite limited.
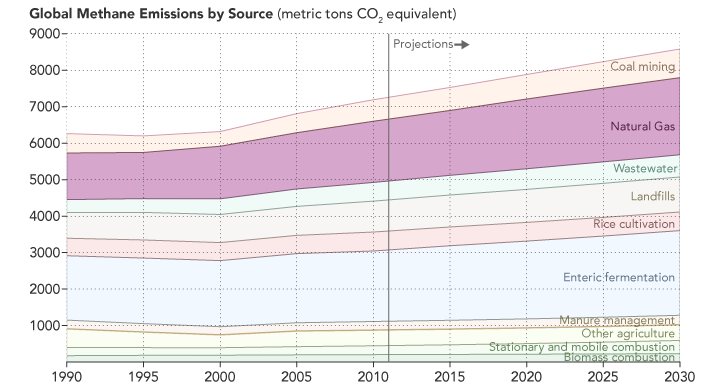
Second only to enteric fermentation (digestion by ruminant animals), natural gas extraction and use accounts for the highest methane emissions across the world. (NASA Earth Observatory image by Joshua Stevens, using data from the EPA.)
Likewise, satellite observations could play a key role, but the current sources of satellite data are also limited. The SCIAMACHY sensor provided global measurements of methane in the troposphere starting in 2003, but it stopped collecting data when the Envisat mission ended in 2012. The TES sensor on NASA’s Aura satellite can measure methane, but it lacks sensitivity in the lower troposphere, where methane emissions occur. The best option now for satellite views of methane in the troposphere is the TANSO sensor on the Japanese GOSAT satellite.
The Dutch-sponsored TROPOMI sensor is scheduled to reach orbit in 2016 and should provide data that is several times more detailed than SCIAMACHY or TANSO. The increased resolution will dramatically improve what can be observed from space and should help scientists fill in gaps where ground and aerial observations are sparse.
Looking farther down the road, the French and German space agencies are working to develop a mission called MERLIN that will bounce a laser-like beam (lidar) off of Earth’s surface in order to detect the chemical signature of methane. The expected launch date is December 2019. Lidar is more expensive than other types of sensors, but it is not affected as much by clouds or airborne particles. Meanwhile, Haris Riris, a scientist based at NASA's Goddard Space Flight Center, is developing a next-generation lidar sensor that could have even greater sensitivity and precision than the sensor on MERLIN.
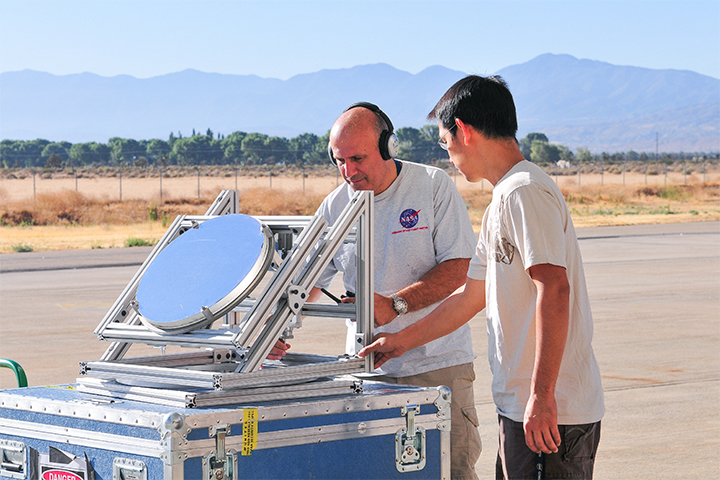
NASA researchers Haris Riris and Stewart Wu use a mirror to adjust a prototype of a new sounder that aims to collect continuous, high-resolution measurements of atmospheric methane. (Photo by Emily Schaller.)
In the meantime, policymakers have started to consider the idea that reducing methane emissions could provide an immediate and relatively cheap way to combat climate change. In 2012, Shindell asserted in a scientific paper that reducing methane and black carbon would prevent 0.5 degrees (Celsius) of projected global warming by 2050.
“Doing something about methane won’t solve our climate problem, but it will help in the near term,” said Shindell. “And if we are ever going to solve the carbon problem, we have to start somewhere.”