
First with GRACE | |||
According to Abdalati, launching those satellites wasn’t the end of the challenges faced by a scientific community hungry for data. “In fact, in some ways,” he says, “launching those missions marked a new beginning.” The data these satellites generated were brand new, and scientists had to learn how to interpret them correctly. Enter Isabella Velicogna, a scientist with a joint appointment at NASA’s Jet Propulsion Lab and the University of Colorado. She speaks with obvious passion for her research, punctuated often with an infectious laugh. Though Velicogna has never set boots on Greenland’s ice, she was among the first to “crack the code” of what GRACE had to tell about how Greenland’s Ice Sheet is changing. The GRACE project team at the University of Texas converted the streams of raw data from GRACE into monthly averaged maps of Earth’s gravity field, which Velicogna converted into ice mass changes. Since GRACE cannot directly calculate the total amount of ice, her study would assess the redistribution, or change, of ice mass. She knew it wouldn’t be easy to tease out the signal in Earth’s gravity field caused solely from mass changes in Greenland’s Ice Sheet. Other geophysical processes in Earth’s environment are also changing, such as ocean circulation patterns and large-scale movements of water on land. Her goal was to distinguish any changes in Earth’s gravity field caused by changes in Greenland’s Ice Sheet from all other possible geophysical changes. |

Isabella Velicogna. (NASA photograph courtesy JPL.) | ||
 | |||
“GRACE gave us a new type of data,” Velicogna explains. “We had to make new model assumptions. At first, no one was sure how those model assumptions and the spacecraft design would affect the results.” For example, Velicogna relied upon a global circulation model to estimate mass in the atmosphere, which she then subtracted from the total gravity signal. Likewise, she assumed that the mass of the mountains underneath the ice sheet was constant so that too could be removed from the equation. And so it went for months as she painstakingly peeled away all the probable causes of changes in Earth’s gravity field except the Greenland ice sheet, which she would gradually isolate. Once she produced a mean measurement of mass for the entire Greenland Ice Sheet in 2002, she could do so again and again with each passing year to determine whether it was changing over time. By 2005, she would finally be able to answer the burning question: Overall, is Greenland’s ice sheet growing or shrinking? Her much-anticipated results showed a net mass loss for the ice sheet of 248 gigatons per year—enough to raise sea level about half a millimeter each year. (A gigaton is one billion metric tons, the mass of a cube of water that is 1 kilometer wide, tall, and deep.) Although other NASA researchers published similar findings shortly after Velicogna, these GRACE results showed a significantly larger loss—four to five times more ice loss—than most estimates that scientists had published before hers, based on different data from the 1990s through 2003. A discrepancy of that magnitude raised a number of questions about the different approaches researchers took. Would the new GRACE data be as useful and reliable for ice sheet research as scientists had hoped? Were Velicogna’s basic approach and underlying research assumptions flawed? Did the analyses that preceded Velicogna’s work overlook something important? Or, did the ice sheet really change that much? |
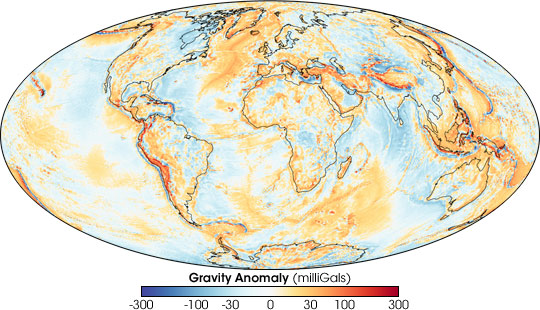
The GRACE satellites map anomalies (difference from average) in Earth’s gravity field. Gravity depends on mass, and mass is influenced by topography and other physical features. High mountain ranges and the Greenland Ice Sheet have greater-than-average gravity (red), while oceanic trenches have lower-than-average gravity (blue). GRACE can also measure changes in gravity over time, providing a method for calculating changes in the mass of the Greenland Ice Sheet. (NASA map by Robert Simmon, based on GRACE data.) | ||