A New Perspective | |||
The challenge facing Abdalati and other researchers was one of perspective. Figuring out whether the entire ice sheet is losing or gaining mass based on data collected at a handful of sites is like crawling on your belly while gazing at individual blades of grass through a microscope to decide if your lawn needs mowing. How difficult is it to interpret the meaning of individual readings or to resolve discrepancies between readings? How would you convert the information you saw through the microscope into a decision to mow or not mow? How many spots must you measure to arrive at a meaningful conclusion? If you stand up and look at the yard, you know in a single glance whether or not the grass needs to be cut. Scientists need this kind of elevated perspective of Greenland. The challenge was developing and launching satellites into orbit that were capable of collecting the data scientists need to measure the mass balance of the entire ice sheet. Abdalati explains that the problem was that the satellites in orbit a decade ago could only provide small pieces of the equation of the ice sheet’s mass balance. Those earlier data were collected over short time spans and therefore could not be pieced together to tell the whole story of what was happening to the ice sheets. For example, Landsat data provided excellent detail of the ice margin, and a means of determining how fast the ice was flowing, but without information on the thickness of the ice sheet scientists could not relate flow rates to how much ice was being discharged from the sheet’s margin. |
|||
 | |||
Scientists could use microwave instruments to determine areas of melt because wet snow reflects microwave signals differently than dry snow. So, data from the Special Sensor Microwave/Imager (SSM/I) allowed scientists to map the extent of the wet snow on Greenland every summer, but they had no way to convert these maps of surface “wetness” to a measurement of the net loss of snow. Moreover, there was no reliable means of estimating how much snow was falling on the ice, nor could scientists determine how snowfall was varying over time, except from a limited sampling of ice cores at various locations on the ice sheet. To figure out whether the ice sheet was growing or shrinking, and by how much, scientists needed more. They needed a means of integrating all of these observations over long periods of time and, more critically, they needed to be able to observe directly how the ice thickness and mass were changing. |
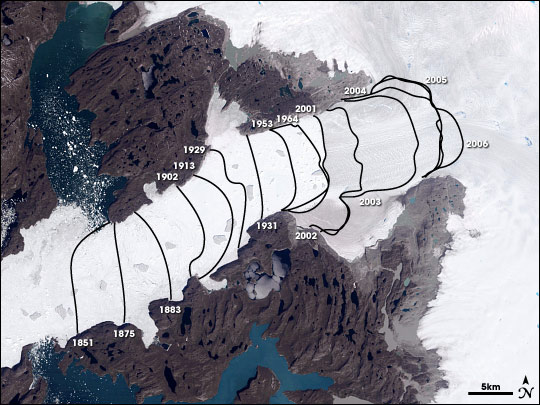
The Jakobshavn Glacier in western Greenland drains the central ice sheet, and it is retreating inland faster than any other. This image shows the glacier in 2001. The glacier flows from upper right to lower left. The fjord beyond the glacier terminus is packed with seasonal ice and icebergs. Terminus locations before 2001 were determined by surveys; more recent contours were derived from Landsat data. Without measurements of ice thickness, however, the picture of ice loss is incomplete. (NASA image by Cindy Starr, based on data from Ole Bennike and Anker Weidick (Geological Survey of Denmark and Greenland) and Landsat data.) | ||
 |
Abdalati and his colleagues pinned their hopes on two missions that would represent a new generation of spacecraft. The first was the twin satellites of the joint NASA and German Aerospace Center (DLR) Gravity Recovery And Climate Experiment (GRACE), launched in March 2002, which detect minute shifts in Earth’s gravity field based on changes in distance between the two satellites. These shifts indicate the mass below the satellites has changed. Over Greenland, the shifts would reveal whether the ice sheet as a whole gained or lost mass. |
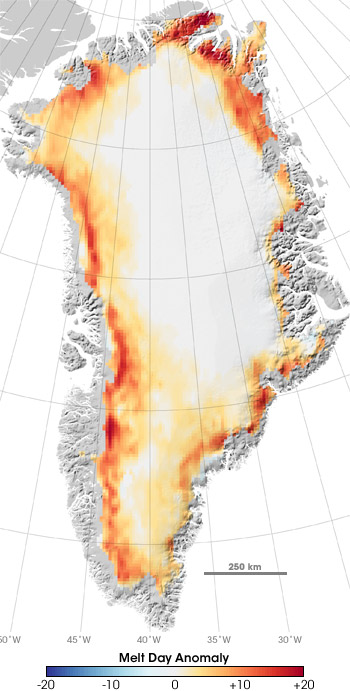
Warmer temperatures are increasing the number of summer days when portions of the surface of the Greenland Ice Sheet melt. Along the margins of the ice sheet, up to 20 additional days of melting occurred in 2005 compared to the average since 1988. (NASA map by Robert Simmon and Marit Jentoft-Nilsen, based on data from Marco Tedesco, GSFC.) | |
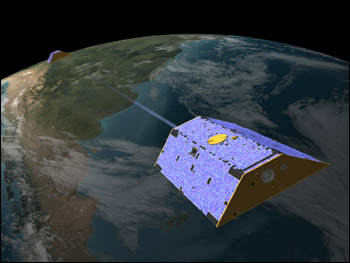 |
The Gravity Recovery and Climate Experiment (GRACE) consists of two satellites orbiting 220 kilometers (140 miles) apart, linked by a microwave ranging system. Together, the satellites measure the mass of the Earth, and can detect changes such as earthquakes, the flow of water, and the movement of ice. (NASA image courtesy JPL.) | ||
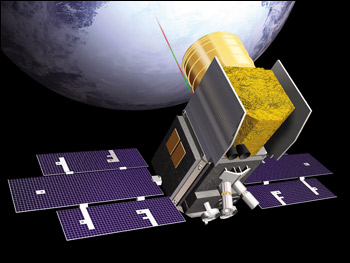
The second mission was NASA’s Ice, Cloud, and land Elevation Satellite (ICESat), launched in January 2003. ICESat uses a sophisticated laser altimetry system to make extremely accurate measurements of Earth’s surface elevation and how it changes over time. Changes in surface elevation of the ice sheet correlate with changes in its mass. Using these two new streams of space-based data—along with all the other information from earlier satellites, aircraft, and field observations—scientists hoped to finally answer the question: Overall, is Greenland’s ice sheet growing or shrinking? |
ICESat maps elevation with a laser using a technique called Light Detection and Ranging (LIDAR). Changes in ice sheet elevation over time represent a gain or loss of mass. (NASA image courtesy GSFC.) | ||
alert message
