
Different Ways of Seeing Species |
|||
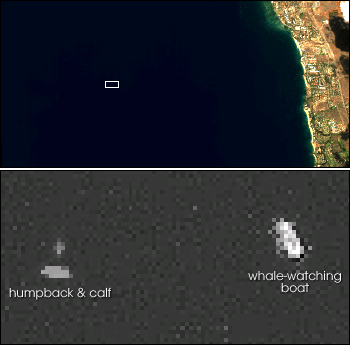
There are several ways space-based technologies can help us understand where species live and why they live there. One way is to directly observe species using satellite sensors with spatial resolutions high enough to actually discern individuals, like a tree or a whale, or collections of species, like a grove of trees. Also, Global Positioning System (GPS) devices allow scientists to track animals’ movements in real time. Difficulties with directly sensing species include the relatively small size of most species, the limitations of the technologies, clouds or vegetation getting in the way, and cost. Because of those limitations, indirect sensing currently provides more opportunities for biologists. Indirectly, scientists can study species by gathering information about their habitats. Satellite remote sensors provide important environmental, biological, and physical information—topography, rainfall, forest cover—that reveal where species are likely to be found. Direct SensingObserving AnimalsMost satellites provide images in lower spatial resolutions (level of detail) that lack the power to detect an individual tree or animal. Still, recent advancements have made direct remote sensing of certain individuals increasingly feasible. For example, a few commercial satellites are now capable of spatial resolutions of one meter or less. At least one has a resolution of 60 centimeters. This means the smallest unit of data captured, called a pixel, averages information over an area of 60 square centimeters, an area of the Earth’s surface roughly 2 feet by 2 feet. “The conventional wisdom is that you need five to ten pixels on a target to recognize it for what it is,” said Ron Abileah, a staff scientist at Vista Research Inc., a company that does commercial and defense research and development. Abileah has researched the possibility of applying imagery from the commercial satellite IKONOS to find and count whales at or near the ocean surface. Space Imaging’s IKONOS satellite produces color images at 4-meter resolution. Abileah’s preliminary studies suggest that this resolution shows some promise, and might one day provide another tool for people who monitor these and other protected whale species. |
|||

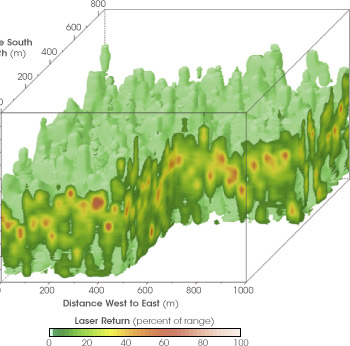
Observing PlantsSome plants make themselves an easy target for satellite sensors by growing in dense mats that spread over many square miles. Satellites that see surface details have been used to map the spread of non-native freshwater plant species, like the water hyacinth invasion in East Africa’s Lake Victoria and the Rio Grande in the southern United States, and the duckweed invasion of Lake Maracaibo in northern South America. Another way to use satellites to directly track plant species is through new hyperspectral sensors, such as NASA’s Hyperion instrument aboard the Earth Observing-1 (EO-1) satellite, which detects 220 distinct wavelengths of light reflected from the Earth. Each surface, whether it is a rock or a maple leaf, reflects its own unique spectrum of light. By detecting the distinct wavelengths of light that represent the signature of a certain type of organism, species community, or material, scientists can directly distinguish different types of surfaces—vegetation from water, soybeans from corn, or pine trees from oaks. Hyperspectral technologies have come in handy in detecting and mapping invasive species that threaten to take over an area. Studies done in the Theodore Roosevelt National Park in Western North Dakota demonstrated that hyperspectral instruments could detect infestations of leafy spurge, an aggressive, persistent, deep-rooted perennial, which grows to a height of 1 meter (3 ft.) or taller. The white-sapped plant has infested more than five million acres of land in 35 U.S. states and the prairie provinces of Canada, overrunning native plants. Scientists used three hyperspectral sensors at three separate spatial resolutions to detect the invasive plant. NASA’s Hyperion instrument had the best results and accurately detected and mapped leafy spurge up to 80 percent of the time. In separate studies, Landsat has also been used to detect leafy spurge in states throughout the Western United States. By identifying areas of greatest concern with satellites, land managers can save time and money by focusing their resources on surveying specific areas. Indirect SensingWhen direct sensing is not possible, satellites provide detailed information about habitats at large scales. As scientists learn more about where certain species live and why they live in those places, they can apply environmental and topographical information gained from satellites to understand the needs of these organisms and where else they are likely to be found. Modeling Watershed ProcessesRemote sensing may never be good at detecting what lives in a stream, but moderate-resolution satellite data can provide sufficient detail over a wide enough area to model and analyze watershed processes. Ned Gardiner uses remote-sensing data to model how stream ecosystems respond to watershed disturbances. In one study, he used Landsat satellite data of land cover and United States Geological Survey (USGS) topographical data of a mountainous area in North Carolina to determine that sediment eroding into highland streams from disturbed land was allowing species that are widely distributed in larger rivers with more fine sediment to invade highland streams. When sediment supply becomes excessive, these widely distributed, sediment-tolerant species replace highland endemics—fish species that are found only in small, steep, clear-water streams. As an added benefit to land use planners, Gardiner also found that the length of unimproved roads in a watershed is a very good predictor of the sediment load of streams and rivers in the watershed. This kind of watershed modeling will continue to evolve as ecologists gain more access to detailed data. “Just as different vegetation types have distinct signatures, watersheds have land use signatures that indicate ecological health of the streams they support,” says Gardiner. Watershed models that use satellite-based observations of the land surface may give people insights into how a planned land use, such as a shopping development or a logging road—might change local ecosystems and organisms. Predicting Species HabitatWhile no single environmental factor drives patterns of biodiversity, many researchers believe three factors play roughly equal roles: vegetation growth, habitat structure, and climate. In 1998, Oxford University zoologists demonstrated how satellite-derived information on environmental conditions could be used to identify habitats of bird species unique (endemic) to certain regions in East Africa. The scientists used a satellite-based indicator of vegetation called “NDVI,” short for Normalized Difference Vegetation Index, a measure of vegetation greenness. The greenness is an indication of vegetation abundance and health in an ecosystem. The scientists also used estimates of rainfall based on data collected by the Meteosat series of geostationary satellites. By combining these satellite observations of modern environmental conditions with elevation data, the scientists predicted the endemic birds’ habitats 89 percent of the time. Mapping Forests in 3-DMost satellite sensors passively record light and heat reflected or emitted toward them from Earth, creating a flat image of the Earth’s surface below. New active sensors, such as lidar, can record information in three dimensions, making it possible to measure habitat structure, topography, and biomass. Active sensors emit a pulse of electromagnetic energy, such as radio waves or light, toward an object and then measure the energy that bounces back to a detector and the time interval between sending and receiving it. In forests, lidar sensors use the return signals to detect the height of the canopy top, ground elevation, and the positions of leaves and branches in between. Longer wavelength pulses of radars can penetrate clouds, and the longest radar wavelengths can penetrate tree canopies, or in cases of bare, dry soil, even the surface of the Earth to depths of a meter or more. The ability to penetrate forest canopies and clouds means lidar and radar could be important tools for measuring biomass and for mapping vegetation structure in three dimensions. Knowing the 3-D vegetation structure in an ecosystem is important for determining how many different species might live there. As Gardiner points out, if a researcher wants to survey spiders in his or her local area, more varieties will be found near a stream with a structurally diverse forest containing several “habitats” or levels, as opposed to a stream area without a forest nearby. Active sensors are providing detailed views of forest structures that have never been possible before. |
Very high resolution satellites are capable of directly observing some animals. Using data from the Ikonos satellite Ron Abileah detected humpack whales off the coast of Maui. The light grey objects on the left of this image are likely a humpback whale mother and her calf. To the right is a whale-watching boat. (Images courtesy Ron Abileah, based on data copyright Space Imaging.) | ||
 |

Ralph Dubayah, a professor of geography at the University of Maryland, College Park, has used the Laser Vegetation Imaging Sensor (LVIS), an aircraft-mounted lidar sensor, and owl demographic data to analyze nesting habitat of spotted owls in the Sierra Nevada Mountains. He wanted to see if there were any structural differences between the places in the forest where the owls nested or traveled and the places where they did not. Dubayah’s team mapped areas with spotted owl nests, followed the owls’ movements, and drew a circle around their domain. Using LVIS, the researchers then analyzed the forest structure within and around the owls’ range. LVIS provided data on canopy structure, the amount of light filtering through the leaves down to the ground, and the height of trees. “We found a pretty strong relationship between these forest structures and owl nesting patterns,” Dubayah says. In other words, for owls’ nests, not just any area will do. How does knowing the owl’s structural preference help foresters and conservationists? The forests of the Sierra Nevada Mountains are subject to tree-thinning efforts to reduce wood fuel for fires, creating controversy. Loggers and fire prevention specialists want to remove the wood, while environmentalists and conservationists seek to protect owl habitat. By quantifying the levels of biomass, canopy structure, and light that owls prefer, people can now know exactly how much of the forest may be removed before such practices impinge upon the owls’ habitat. “In the absence of this kind of quantitative analysis, there is no way to know how much we can thin,” Dubayah said. “Lidar provides this quantitative underpinning that has been missing. Vertical profiles, distribution of trees, tree heights, these are exceptionally difficult data to get on the ground, whereas lidar explicitly gives you the vertical structure you are looking for.” |
New remote sensing technologies are mapping ecosystems in new ways. Data from air- and spaceborne lasers reveal forest canopies in three-dimensions. This image shows the structure of a tropical forest in La Selva, Costa Rica. Color corresponds to the amount of laser energy reflected from trees and leaves back to an airborne sensor—a measurement proportional to the density of the forest canopy. (Image courtesy John Weishampel, University of Central Florida) |