
Vegetation Maps | |||
It was only natural for Budde to turn to NASA for vegetation maps: NASA remote-sensing ecologist Jim Tucker has been producing the maps for FEWS NET for well over two decades, almost since FEWS NET was established in the early 1980s. His approach to monitoring crops from space relies on a wide, low-resolution (low-detail) view of the region. “When we first started processing coarse-resolution data to look at vegetation, people said we were stupid,” states Jim Tucker in a matter-of-fact tone. The idea of using satellite imagery to track plant growth over a broad area was nothing new, but scientists, crop analysts, and land managers had always used the most detailed images they could get their hands on. After all, how can you tell how drought is affecting a field of corn if you can’t see the field? In the early 1980s, when Tucker started his work, the most detailed imagery available showed 80 meters in a single image pixel. So when he and his colleagues decided to monitor vegetation with a satellite that could “see” no better than 8 kilometers per pixel, it is easy to see why people thought they were crazy. |
|||
 | |||
The problem with detailed images, Tucker points out, is that the satellites that acquire the images only see a small part of the Earth every day. Why not just go outside to see how things are growing? Some problems are bigger than a single person on the ground or even a single high-resolution satellite image can assess. To see just how widespread famine is, Tucker realized they needed a bigger picture, a picture they could get only with coarse-resolution data. But could less detailed images provide enough information to be valuable? “Temperatures and precipitation are similar on a small scale,” Tucker points out. All of the plants in the region covered by detailed images are affected roughly the same way. To see large-scale patterns of drought and rainfall, you need coarse resolution imagery. “The idea is to have a lot of tools,” says Tucker. The lower-resolution, daily images reveal broad patterns, show how conditions change from day to day, and provide a long-term record, while the detailed images allow scientists to zoom in to get a close look at the effects of drought. The images that Tucker produced are not like photos; they are a vegetation “index,” or scale, based on the kind of light reflected from the ground or vegetation surface in a region. Plant leaves absorb visible light for photosynthesis and reflect near-infrared light. If a satellite detects significantly more near-infrared light than visible light, the region is likely to be densely vegetated. By comparing the difference in intensity between visible and near-infrared light measured over crop areas in current imagery with the difference measured at the same time in past years, Tucker can tell how leafy a crop region is compared to normal. Plotting out the anomalies reveals where vegetation is thicker than normal because of good conditions or thinner than normal as a result of drought. [To learn more see Measuring Vegetation on the Earth Observatory.] |
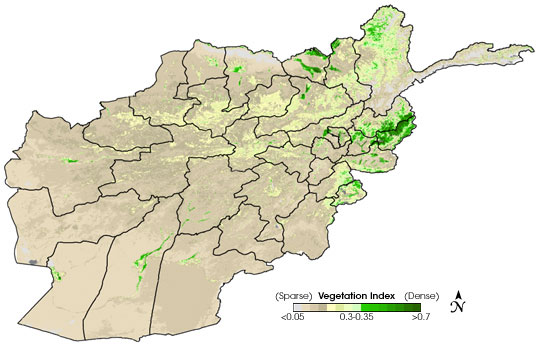
This map shows Afghanistan’s vegetation index for August 13-28, 2005. Deep green indicates dense vegetation, and earth tones indicate sparse vegetation. Most of the country is sparsely vegetated. (Map courtesy FEWS NET) | ||
 | |||
“It works well because you have a strong relationship between precipitation and photosynthesis,” says Tucker. In non-irrigated grass and shrublands, the more rain a plant gets, the more leaves it can produce, and more leaves mean more photosynthesis. According to Tucker, “Satellite [vegetation] data are a better representation of rainfall than a scattered network of ground stations. Satellite data provide a consistent, unbiased way to see what really happened on the ground.” But perhaps the most valuable aspect of using coarse-resolution imagery is the long-term record that scientists can build from it. Low- and medium-resolution sensors—the Advanced Very High Resolution Radiometer (AVHRR), Spot Vegetation, and the Moderate Resolution Imaging Spectroradiometer (MODIS)—see the entire Earth every day. Tucker combines the daily images into ten-day composites to minimize cloud cover. By contrast, a high-resolution sensor may only acquire a single image during the same period. If it is cloudy, then there is no record of the crop area for that ten-day period. Since the low-resolution composites are made for every ten-day period of every year, the method provides a way to contrast current conditions with past conditions during the same period. For example, knowing that the first ten days of June 2005 were drier than the first ten days of June 2004 and much drier than the average of similar periods over a 20-year record can help decision makers understand the seriousness of the drought. The record also shows vegetation change over time, which could be valuable when tracking climate trends, monitoring natural resources or agricultural production, or reducing human suffering. “FEWS NET saw NASA work and asked if we would be willing to work with them,” Tucker recalls. More than two decades later, he and his team are still supplying FEWS NET with regular vegetation maps. “It’s an excellent example of the value of satellite data,” says Tucker. “I’m proud to be involved in FEWS NET.” |
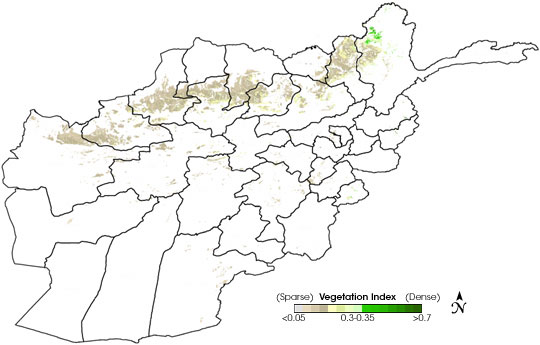
Along Afghanistan’s northern border, most of the crops are rainfed. This map shows the vegetation index of the rainfed agricultural regions for August 13-28, 2005, with all other types of vegetation removed. Deep green indicates dense vegetation, and earth tones indicate sparse vegetation. Maps such as these isolate rainfed crops, making it easier for decision makers to gauge growing conditions quickly. (Map courtesy FEWS NET) | ||