
By Dr. Steve Ryan, NOAA
Mauna Loa is indeed an active volcano; it last erupted in 1950, 1975, and 1984. Between eruptions, it emits variable amounts of carbon dioxide (CO2) and sulfur dioxide (SO2) from fissures at the summit. The observatory is located on the northern slope of the mountain, 4 miles away from and 2,600 feet lower than the summit, which is 13,675 feet above sea level.

Most of the time, the observatory experiences “baseline” conditions and measures clean air which has been over the Pacific Ocean for days or weeks. We know this because the CO2 analyzer usually gives a very steady reading which varies by less than 3/10 of a part per million (ppm) from hour to hour. These are the conditions we use to calculate the monthly averages that go into the famous 50-year graph of atmospheric CO2 concentration.
We only detect volcanic CO2 from the Mauna Loa summit late at night at times when the regional winds are light and southerly. Under these conditions, a temperature inversion forms above the ground, and the volcanic emissions are trapped near the surface and travel down our side of the mountain slope. When the volcanic emissions arrive at the observatory, the CO2 analyzer readings increase by several parts per million, and the measured amounts become highly variable for periods of several minutes to a few hours. In the last decade, this has occurred on about 15% of nights between midnight and 6 a.m.

These periods of elevated and variable CO2 levels are so different from the typical measurements that is easy to remove them from the final data set using a simple mathematical “filter.”
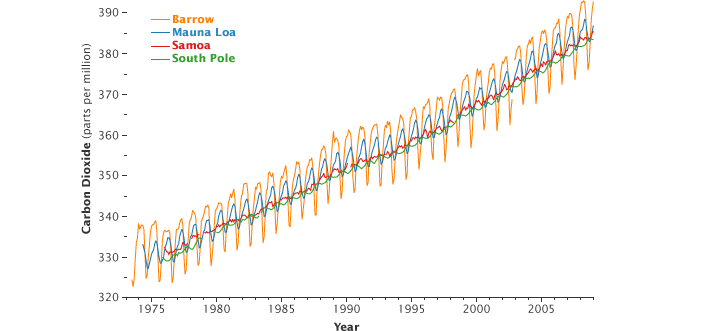
NOAA’s Earth Science Research Laboratory program also measures CO2 in weekly flask samples taken at over 60 remote locations around the world. The Mauna Loa Observatory baseline CO2 concentrations agree very well with flask measurements taken at a similar latitude around the world, which confirms that the volcanic CO2 does not affect our final results. These measurements all show significant increases in CO2 over the last few years. (You can find this information up through the end of 2007 on our website at www.esrl.noaa.gov/gmd/ccgg/.)
Although the volcanically contaminated CO2 data are removed from the global averages, they are still scientifically useful. I have published two papers in which I used the non-baseline, volcanically contaminated, data to reconstruct a 50-year history of CO2 emissions from Mauna Loa volcano. This is by far the longest continuous record of volcanic CO2 anywhere in the world. It shows that the CO2 emissions are greatest right after each eruption and then decrease at a well-defined inverse-exponential rate in the following years.

For example, right after the 1984 eruption, the volcano was producing over 100,000 metric tons of CO2 per year (equivalent to a town of 40,000 people). It has decreased steadily ever since and is now at only about 1,000 metric tons per year, the lowest it has been since our record began in 1958. These measurements are valuable to volcanologists trying to model the evolution of subsurface magma chambers throughout an eruption cycle. You can read more about this topic at www.mlo.noaa.gov/programs/esrl/volcanicco2/volcanicco2.html.