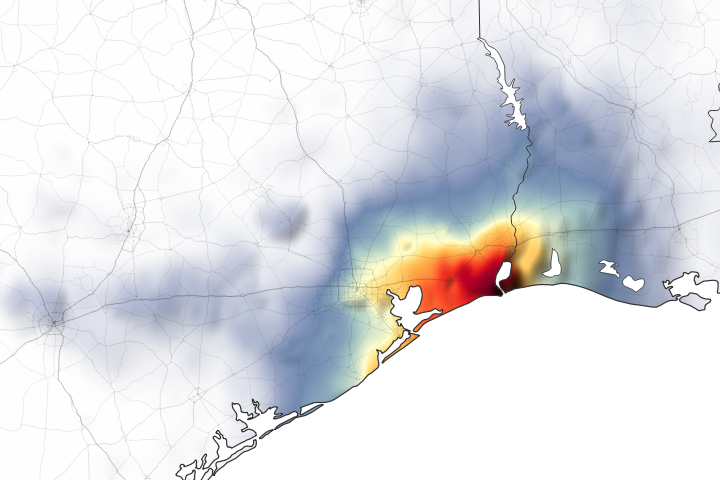
When Hurricane Maria swept across Puerto Rico on September 20, 2017, meteorologists expected it to deliver a tremendous amount of rain in a short period of time. Satellite data confirm that that is exactly what happened.
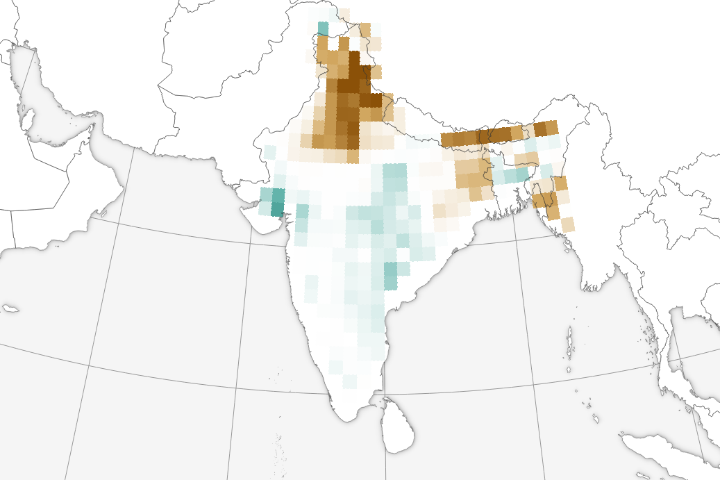
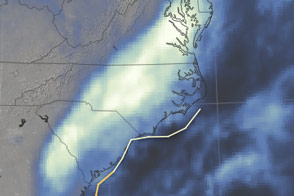
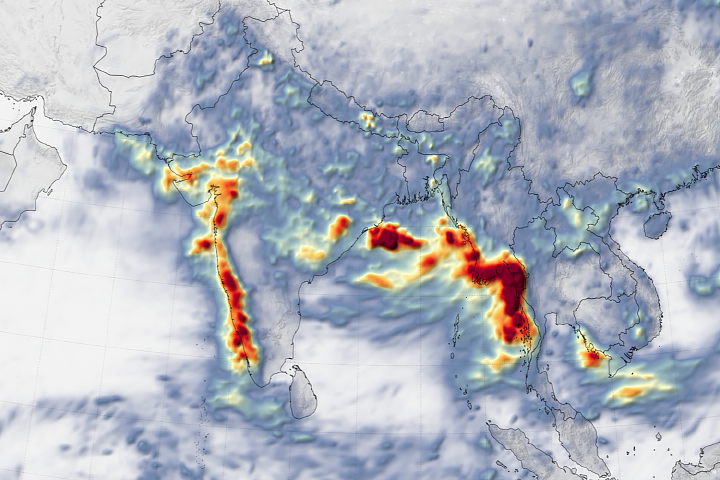
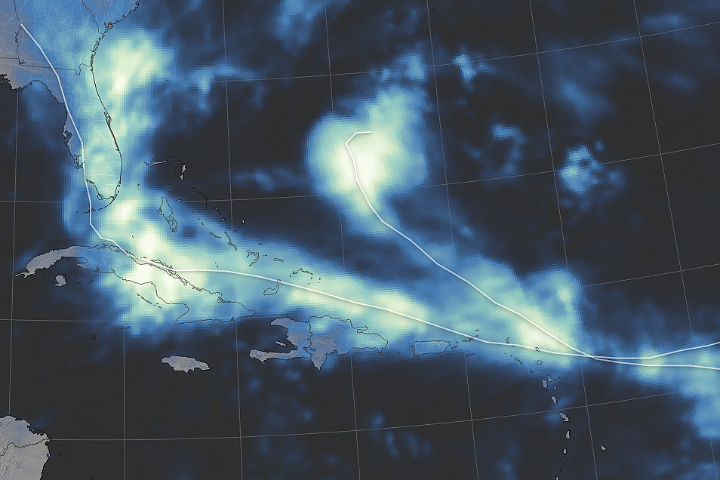
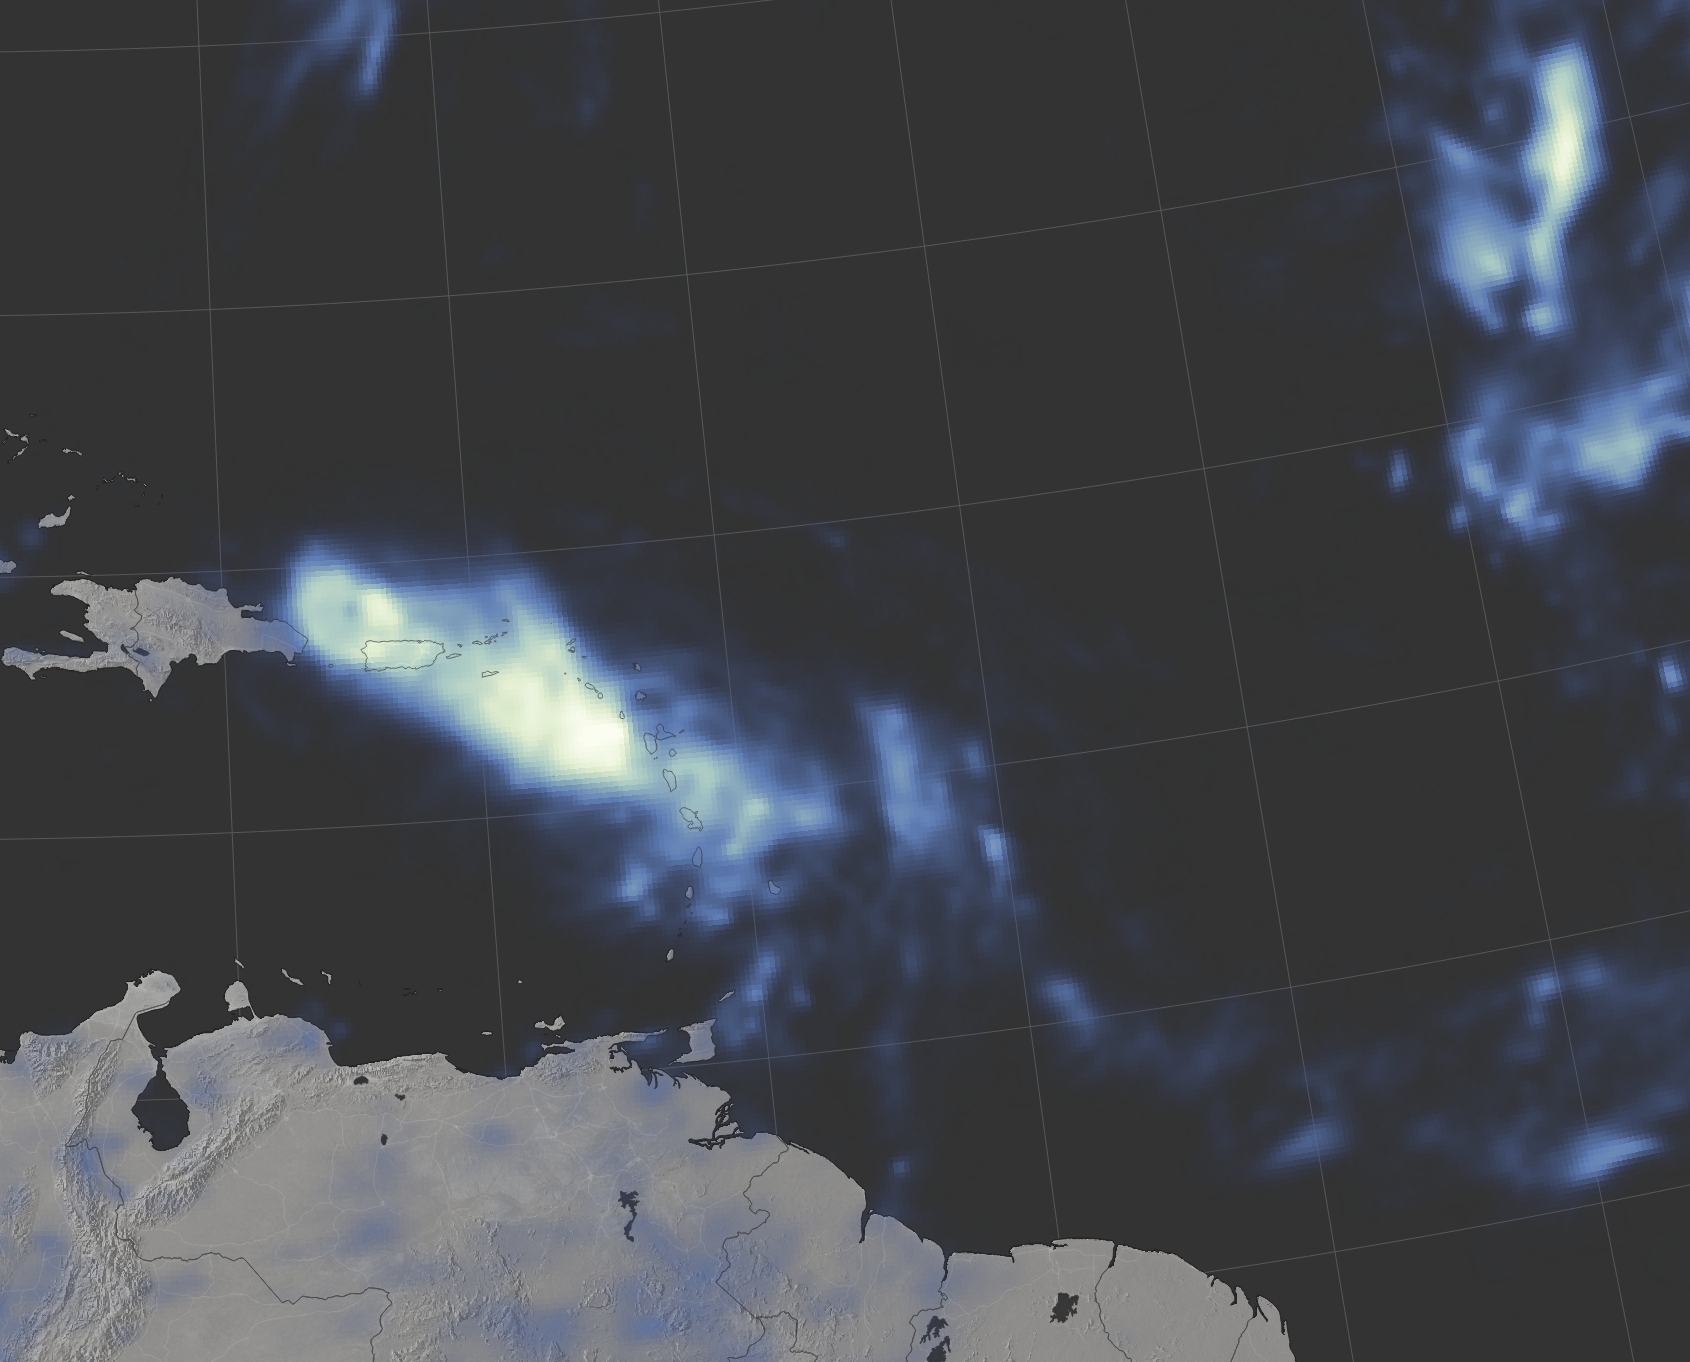
This map shows satellite-based measurements of rainfall in the Caribbean near Puerto Rico. It depicts measurements from the evening of September 18 to the evening of September 20. The brightest areas reflect the highest rainfall amounts—as much as 20 inches (500 millimeters) in places.
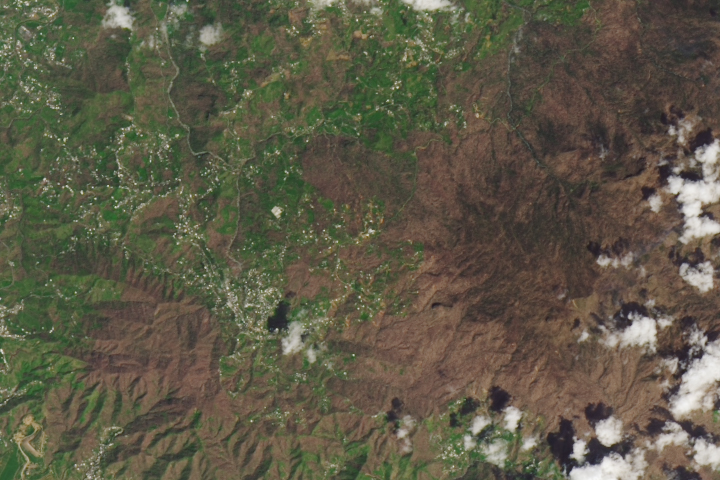
Rain bands trailing the storm continued to deliver heavy rain to the island on September 21-22. The National Hurricane Center reported catastrophic flooding, particularly in mountainous areas, and noted that mudslides should be expected. Mountainous terrain channels floodwater into streams and rivers. Gauges in these rivers show that many, such as the Rio Grande de Manati, have reached record-high levels.
After Maria left Puerto Rico, it moved on to the Dominican Republic and battered parts of the island with heavy winds and rain. According to news reports, most parts of this island saw at least 6–12 inches (150–300 millimeters), with some areas seeing as much as 20 inches (500 millimeters).
These measurements are a product of the Global Precipitation Measurement (GPM) mission, which is a partnership between NASA, the Japan Aerospace Exploration Agency, and five national and international partners. The rainfall totals are regional, remotely-sensed estimates. Each pixel shows 0.1 degrees of the globe (about 7 miles at the equator), and the data are averaged across each pixel. Individual ground-based measurements within a pixel can be significantly higher or lower than the average.
Data for the map comes from the Integrated Multi-Satellite Retrievals for GPM (IMERG), a product of the U.S. GPM science team. IMERG compiles precipitation estimates from passive microwave and infrared sensors on several satellites, as well as monthly surface precipitation gauge data, to provide precipitation estimates between 60 degrees North and South latitude.
NASA Earth Observatory image by Joshua Stevens, using IMERG data from the Global Precipitation Mission (GPM) at NASA/GSFC. Caption by Kathryn Hansen.
alert message