

Perspectives from On High |
|||
Glaciologists received a huge technological boost with the arrival of Global Positioning System (GPS) satellites in the late 1980s. Almost overnight this technology fundamentally changed how glaciologists survey ice sheets. Affixing antennas with the ability to receive GPS signals onto their flagpoles dramatically simplified scientists’ ability to monitor the movements of ice sheets over much larger areas. The GPS technology also improved the precision of scientists’ measurements and, once deployed, the devices allowed them to collect their data from the safer confines of their workspaces with less personal risk. Handheld GPS devices also allow scientists to travel in Antarctica without the burden of planting flagged poles every half a kilometer. “GPS has made recording data in the field much easier than it was before,” states
Bindschadler. “But even that doesn’t tell us all we need to know to understand ice sheets.” |
|||
New satellite technologies give glaciologists the tools to begin answering these questions. From the perspective of space, satellite sensors collect data over Earth’s entire surface almost every day and, because most climate research satellites orbit from pole to pole, they collect data over the polar regions as often as fourteen times a day. Moreover, because some satellite sensors are sensitive to regions of the electromagnetic spectrum that our eyes cannot see, satellites provide a much more complete picture of our world’s ice sheets than scientists could get any other way. For example, the Defense Military Satellite Program’s Special Sensor Microwave Imager (SSM/I) is very good at detecting where and when snow and ice get wet. NASA developed and demonstrated this new capability with its SMMR instrument launched in 1978 aboard the Nimbus satellite. SMMR and SSM/I microwave data have helped scientists to monitor melting on the surface of Earth’s ice masses. NASA extended scientists’ ability to monitor ice melt with the May 2002 launch of the Aqua satellite, which carries Japan’s Advanced Microwave Scanning Radiometer for EOS (AMSR-E). |
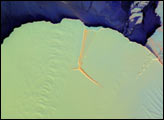
Satellite optical sensors viewing the surface in multiple wavelengths of light, and at multiple angles, can reveal details otherwise hidden. In this 2002 false-color image, the Terra satellite’s Multi-angle Imaging SpectroRadiometer (MISR) substituted color for viewing angle to reveal a large crack forming in East Antarctica’s Amery Ice Shelf—an iceberg early in the calving process. To make this false-color image, scientists combined MISR’s red band data from its 60-degree aft-viewing camera (displayed as blue), its downward-looking camera (green), and its 60-degree forward-viewing camera (red). The different colors represent differences in the light reflected at different angles. (Image courtesy NASA/GSFC/LaRC/JPL, MISR Team) |
||
 |
|||
According to Waleed Abdalati, Head of the Cryospheric Sciences Branch at NASA GSFC, these satellite data confirm a trend of increased melting around Greenland. “As global temperature rises, the melting will accelerate,” states Abdalati. Bill Krabill, a glaciologist at NASA’s Wallops Flight Facility, reports an overall thinning of Greenland’s ice sheet at lower elevations, by as much as 70 meters in some places in just the last five years, which is a direct contribution to sea level change. But melting is only half of the problem. Jay Zwally, glaciologist at NASA GSFC, observed that much of the
melt water doesn’t simply run off the ice sheet; rather, the water flows downward through large
and small cracks in the ice sheet and eventually reaches the bottom. This water acts as a lubricant that
helps accelerate the flow of ice streams and the rate of icebergs calving off the edge of the sheet. |
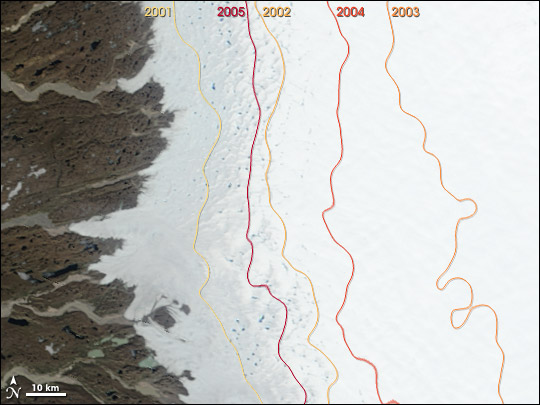
Like much of the Arctic, Greenland experienced record melting in 2002. In this image, colored lines represent approximate melt zones for June 2001 through June 2005. September melt zones are more extensive because they reflect the entire season’s melt. (Image by Robert Simmon, NASA Earth Observatory) |
||
About half of the loss of Greenland’s ice mass into the North Atlantic Ocean is in the form of melt water, and the other half is in the form of calving icebergs. Each year, Greenland’s loss of ice contributes about 10 percent of today’s 3-millimeter rise in sea level per year. That number seems small, but scientists are concerned that the rate could increase through a positive feedback loop. Warmer temperatures cause melting, which leads to faster flow, drawing more of the ice sheet down to lower altitudes and warmer temperatures, which contributes to more melting, which leads to more ice acceleration and thinning, and so on. Conversely, there is not a lot of melting in Antarctica because temperatures are too cold year round. There, glaciologists’ main concern centers on the flow rate within the vast network of ice streams. Is Antarctica losing ice to the ocean through these streams faster than it is accumulating ice through annual snowfall? Help answering this question has come in the form of three different types of satellite sensors. Like sophisticated, space-based digital cameras, optical sensors aboard NASA’s Landsat, Terra, and Aqua satellites allow scientists to track changes on the surface, such as icebergs calving and drifting, and to see how those changes relate to other variables, like topography and temperature. Some instruments aboard these satellites produce high-resolution images in which subtle changes in shading and surface features reveal the locations of cracks and crevasses. Scientists can track these crevasses to determine flow rates, much like they used poles in earlier years. While optical sensors can determine how much area is covered by ice, they cannot observe whether the ice is getting thicker or thinner. It is possible for an ice sheet to shrink in terms of area and yet gain mass through annual snowfall accumulation, thus making the sheet thicker. The latest report by the Intergovernmental Panel on Climate Change (IPCC) predicts that as average global temperature rises, Antarctica is likely to gain ice mass due to increased snowfall. A team of researchers led by Curt Davis, University of Missouri, supported the IPCC’s prediction in a May 2005 issue of the journal Science. Specifically, analyzing radar data collected by European Space Agency satellites from 1992 to 2003, Davis’ team found that East Antarctica gained about 45 billion tons of ice per year. To put this weight gain into perspective, it corresponds to removing the top 0.12 millimeters of the ocean and spreading it over an 8.5 million-square-kilometer area in Eastern Antarctica. While it is welcome news that Eastern Antarctica is helping to slow the rate of sea level rise, Davis’ team’s finding only intensifies the mystery of what is causing sea level to rise. Satellite measurements suggest that in the last 10 years the rate of sea level rise has quickened to 3 millimeters a year (accurate to within plus or minus 0.5 millimeters), but scientists can only account for about two-thirds of this rise. Like all physical bodies, water expands when it warms, and scientists estimate that the ocean’s increased temperature has caused it to expand by 1 millimeter overall. Ice loss from Greenland, Antarctica, and smaller ice sheets and glaciers all over the world account for another millimeter in sea level rise. So where is that last millimeter coming from? Waleed Abdalati notes that while Davis’ findings show increased thickness in East Antarctica’s continental interior, scientists still don’t know whether the ice is thickening or thinning along the coastal edges of East Antarctica. If scientists don’t fully understand the mechanism then they cannot account for it accurately in their models, and they cannot say whether its effect on sea level is likely to increase, decrease, or stay the same. To help scientists determine whether Antarctica’s ice mass is in or out of balance, in 2003 NASA launched its Ice, Cloud, and Land Elevation Satellite, or ICESat. ICESat carries a laser altimeter that beams pulses of green and infrared light straight down at Earth 40 times per second and then collects the reflected light in an onboard one-meter telescope. The time it takes the light to travel from the satellite to its target and back again directly relates to the height of the target. Such measures allow scientists to map the elevations of ice sheets all over the world more accurately than ever before—improving upon the vertical resolution of older radar technologies by about 20 times. Thus, glaciologists now have the ability to measure ice extent, flow rate (using optical sensors), and thickness (using laser altimeters). |
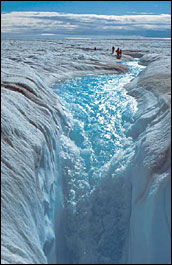
A common sight in Greenland, a meltwater stream flows into a large moulin. (Photo courtesy Roger J. Braithwaite, University of Manchester, United Kingdom) |
||
“We discovered that parts of the West Antarctic Ice Sheet are thinning more than a meter per year—faster than anyone imagined,” Bindschadler states. The mass balance of the West Antarctic Ice Sheet is about 10 percent of all the ice on the planet, and some sections are shrinking at alarming rates. These most active sections are adding about 0.2 millimeters per year to sea level, or about 7 percent of the recent annual rise. |
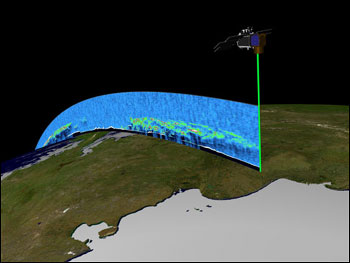
Orbiting the Earth at nearly 17,000 miles (27,360 km) per hour, NASA’s ICESat collects three-dimensional measurements of the Earth’s surface and atmosphere. (Image courtesy Scientific Visualizations Studio, NASA GSFC) |
||
 |
|||
To help glaciologists understand why the West Antarctic Ice Sheet is losing ice, the Synthetic Aperture Radar (SAR) allows them to map and monitor the continent’s ice streams and even to peer beneath the surface to locate subsurface crevasses. SAR has the added advantage of being able to penetrate clouds, which is important because the coast of West Antarctica is one of the cloudiest places on Earth. A portion of the radar signal reflects off the ice surface while the penetrating energy scatters off deeper snow and returns to space, where subtle differences in the signal are picked up by the radar’s detectors. Because different ice features yield distinct patterns in various radar wavelengths reflected back to the satellite, any fractional difference in the radar reflectance allows scientists to precisely pinpoint where each distinct part of the ice has moved as well as how far and how fast. |
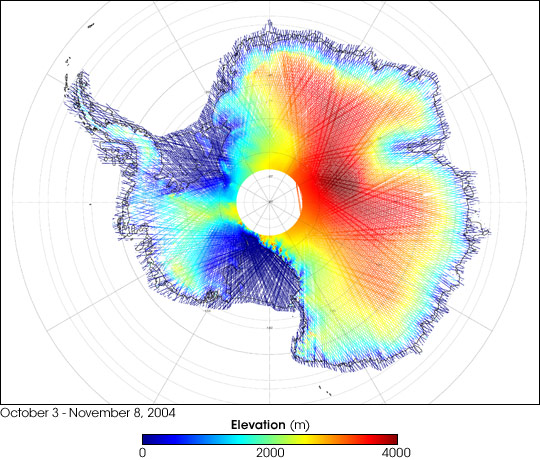
The colors on this map represent ICESat’s measurements of Antarctica’s topography, using data collected from October 3 through November 8, 2004. Red shows the highest elevations (up to 4,000 meters above sea level). Yellow, green, and turquoise show progressively lower elevations (green is 2,000 meters above sea level). Dark blue shows sea level. (Image courtesy Chris Schuman, NASA GSFC) |
||
 |
|||
“Now we can track the movements of the snowpack even when there aren’t observable [to the human eye] features on the surface,” Bindschadler says triumphantly. “Satellite technology has torn away the shroud and allowed us to observe detailed patterns of ice flow within an ice sheet. These new data reveal a very strongly organized network of ice streams flowing within Antarctica’s ice sheets.” Overall, what do satellites tell scientists about the current state of Earth’s ice sheets? |
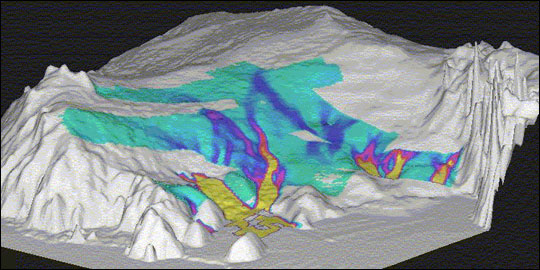
This visualization shows ice velocity data from Synthetic Aperture Radar measures superimposed on a three-dimensional model of the surface in West Antarctica. The colored patterns represent ice streams flowing off the grounded West Antarctic Ice Sheet onto the Ross Ice Shelf. The speed of the ice increases as the colors change from light green (slow) to purple to red to yellow (fast). (Image courtesy the Scientific Visualization Studio, NASA GSFC) |
||