|
Solar Variability
|
Solar Radiation and Climate Experiment (SORCE)
The SORCE Satellite
Related Articles
Related Datasets
| ||
 |
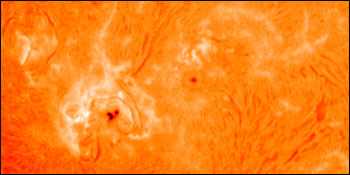
Daily variation in solar output is due to the passage of sunspots across the face of the Sun as the Sun rotates on its axis about once a month. These daily changes can be even larger than the variation during the 11-year solar cycle. However, such short-term variation has little effect on climate. The graph above shows total solar irradiance on a daily basis. The plot is based on data collected by the ACRIM III instrument, which is currently in orbit. (Graph by Robert Simmon, based on data from ACRIM III) Variations in TSI are due to a balance between decreases caused by sunspots and increases caused by bright areas called faculae which surround sunspots. Sunspots are dark blotches on the Sun in which magnetic forces are very strong, and these forces block the hot solar plasma, and as a result sunspots are cooler and darker than their surroundings. Faculae, which appear as bright blotches on the surface of the Sun, put out more radiation than normal and increase the solar irradiance. They too are the result of magnetic storms, and their numbers increase and decrease in concert with sunspots. On the whole, the effects of the faculae tend to beat out those of the sunspots. So that, although solar energy reaching the Earth decreases when the portion of the Sun’s surface that faces the Earth happens to be rife with spots and faculae, the total energy averaged over a full 30-day solar rotation actually increases. Therefore the TSI is larger during the portion of the 11 year cycle when there are more sunspots, even though the individual spots themselves cause a decrease in TSI when facing Earth.
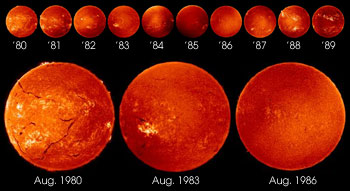
The number of sunspots visible from the Earth not only changes from day to day, but also in cycles that can last from decades to centuries to millennia. The most well-known and well-analyzed of these cycles is the 11-year sunspot cycle. Over the course of 11 years, the yearly average number of sunspots and faculae slowly increases and then return to normal levels before rising again for the subsequent cycle. The change in the Sun’s yearly average total irradiance during an 11-year cycle is on the order of 0.1 percent or 1.4 watts per square meter.
Another trend scientists have picked up on appears to span several
centuries. Late 17th century astronomers observed that no
sunspots existed on the Sun’s surface during the time period from 1650
to 1715 AD. This lack of solar activity, which some scientists attribute
to a low point in a multiple-century-long cycle, may have been partly
responsible for the Little Ice Age in Europe. During this period,
winters in Europe were much longer and colder than they are today.
Modern scientists believe that since this minimum in solar energy output,
there has been a slow increase in the overall sunspots and solar energy
throughout each subsequent 11-year cycle. | ||
 |
The number of sunspots on the Sun’s surface is roughly proportional to total solar irradiance. Historical sunspot records give scientists an idea of the amount of energy emitted by the Sun in the past. The above graph shows sunspot data from 1650 to the present. The Maunder Minimum occured from 1650–1700 and may have influenced Europe’s little ice age. (The data from this period are not as reliable as the data beginning in 1700, but it is clear that sunspot numbers were higher both before and after the Maunder Minimum.) Since then, sunspot number have risen and fallen in a regular 11-year cycle. An 11-year running average shows only the long-term variation, which shows a rise in total sunspot numbers from 1700 until today. [Graph by Robert Simmon, based on data compiled by John Eddy (1650-1700) and the Solar Influences Data analysis Center (SIDC)] Lastly, on the time scale of the lifetime of the solar system, measured in billions of years, the Sun is going through the same life and death cycle as any average star. As it uses up its hydrogen fuel, the Sun grows hotter and hotter throughout its lifetime. In a couple of billion years, this gradual heating will melt all the ice on Earth and turn the planet and into a hothouse much like Venus. Since the increase occurs over such an extended period of time, today’s instruments cannot even detect year-to-year changes along this cycle. By the time the effects of this warming trend are felt, it’s possible humans may have become extinct, or found a way to populate distant planets, and in either case may not still be left on Earth worrying about Earth’s demise. next: The Sun and Global Warming
|