
Decreasing the Impact of Disaster with Remote Sensing | |||
“In 2002, many rural families in Central America were suffering from hunger and acute malnutrition,” says Michael Budde, a remote sensing specialist with the Famine Early Warning Systems Network, funded by the U.S. Agency for International Development. Drought in 2001 destroyed the subsistence crops that these families relied on, and at the same time, a sharp drop in coffee prices deprived many of the people of their employment on coffee plantations—their second source of livelihood. “In 2002 there was great interest in having an early indication of harvest prospects to see if drought would strike again, and if so, where,” says Budde. The scientists turned to NASA’s Tropical Rainfall Measuring Mission satellite to monitor rainfall across Central America. They tracked the amount of rain and when it fell in relation to the growing needs of maize, the primary crop of the region. The results revealed a clear drought corridor through Honduras and Nicaragua. “This was the first time a regional view of drought had been provided, and the pattern was confirmed by field reports. The information helped direct limited resources into specific sub-national areas, to the benefit of tens of thousands of families,” says Budde. |
|||
| |||
 |
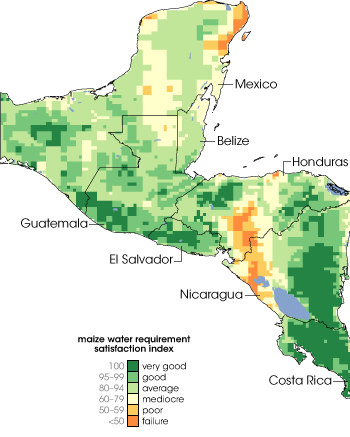
A drought during 2002 led to a food shortage in rural Honduras and Nicaragua. USGS researchers helped the Famine Early Warning Systems Network map the extent of the drought with satellite measurements of rainfall. This map shows the rainfall received in the area during the 2002 growing season relative to the amount of rain necessary for healthy maize (corn) crops. The drought was most intense in western Nicaragua and southern Honduras, indicated by the orange coloring. (Map courtesy Michael Budde, USGS EROS Data Center) | ||
| |||
On the forefront of drought monitoring in famine-prone nations, the Famine Early Warning System Network tracks developing droughts in Africa, Central America, and Afghanistan using a convergence of evidence from both NASA and National Oceanic and Atmospheric Administration satellites as well as ground reports. The network distributes the information to aid organizations and governments to help them plan a response to the food crisis. |
|||

The United States Department of Agriculture’s Foreign Agricultural Service similarly uses NASA data to monitor crops in countries not covered by the famine network. One of the tools that both organizations rely on is the Moderate Resolution Imaging Spectroradiometer, MODIS, on NASA’s Terra and Aqua satellites. Unlike high-resolution sensors such as Landsat, MODIS acquires images of the entire world every day, providing an overview of the Earth with a level of detail that was not possible before. Further, MODIS data are free, making global monitoring projects possible for many organizations. Both the Famine Early Warning Network and the Foreign Agricultural Service use MODIS data to quantify how greatly crop production might be affected by natural disasters. |
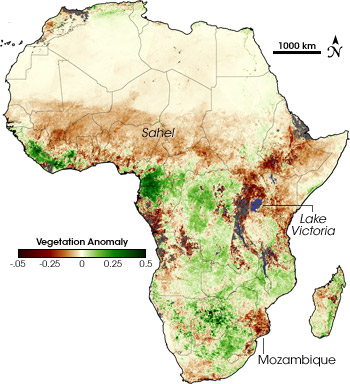
Satellite measurements of vegetation health compared to the average vegetation at a specific time of year can reveal patterns of drought. Orange colors indicate vegetation that is less dense and healthy than normal, while green represents healthier than normal vegetation. This image of vegetation anomaly from March 1–10, 2005, shows stressed vegetation in the Sahel, on the north shore of Lake Victoria, and Mozambique. (Image courtesy Molly Brown, NASA GSFC Biospheric Sciences Branch.) | ||
 | |||
At the Dartmouth Flood Observatory, Brakenridge tracks floods using MODIS. When a flood occurs, Brakenridge compares MODIS images of the flood area with images taken before the flood to map out exactly which areas are flooded. In some instances, he has provided flood maps to the United States Army and the U.S. State Department, which provides the information to local government for flood response. The maps also provide a record of flooding, which can be valuable in future planning. |
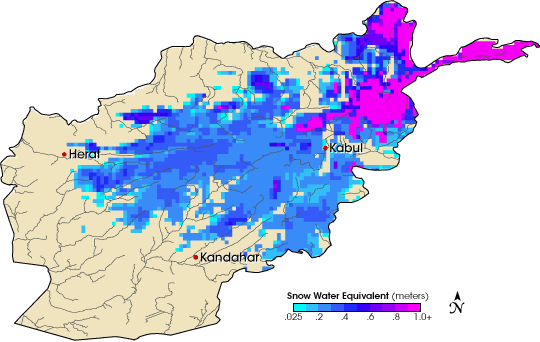
The thick snows covering Afghanistan’s mountains on March 13, 2005, are contributing to flooding as the spring melt progresses. This map shows snow water equivalent, which represents the amount of liquid water contained in the snow. The measurements, derived from satellite data, help predict flooding. (Map courtesy FEWS NET) | ||
 | |||
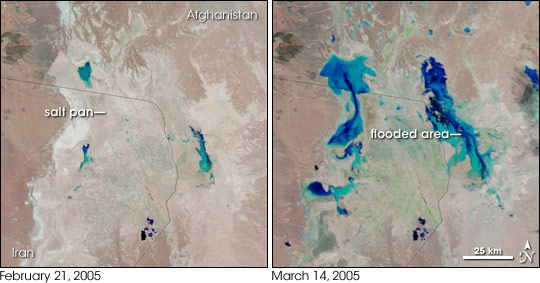
Following the winter’s heavy snowfall, the once-dry Hamoun wetlands along the Afghan/Iranian border filled with water. These images compare the wetlands on February 1, 2005 (left), and March 14, 2005 (right). The wetlands had been drying due to a severe drought that started in 1998 and increased irrigation along the Helmand River. (NASA images courtesy MODIS Rapid Response System) | |||