
by Holli Riebeek· design by Robert Simmon· May 9, 2006 From the oceans’ depths to the polar ice caps, clues to the Earth’s past climates are engraved on our planet. Sea sediments reveal how much ice existed in the world and hint at past temperatures and weather patterns. Ice cores also provide a glimpse of past temperatures and preserve tiny bubbles of ancient atmosphere. Coral, tree rings, and cave rocks record cycles of drought and rainfall. Each piece of this complex puzzle must be put together to give us a picture of Earth’s climate history. Scientists’ efforts to explain the paleoclimate evidence—not just the when and where of climate change, but the how and why— have produced some of the most significant theories of how the Earth’s climate system works. |
| ||
 | |||
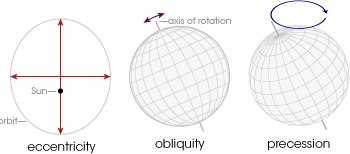
The Earth’s Shifting OrbitFrom the scratched rocks strewn haphazardly across the landscape and the thin layer of soil left behind by retreating glaciers, scientists learned that the Earth had gone through at least three or four ice ages. Noticing that the ice came and went cyclically, they began to suspect that the ice ages were connected to variations in the Earth’s orbit. The Earth circles the Sun in a flat plane. It is as if the spinning Earth is also rolling around the edge of a giant, flat plate, with the Sun in the center. The shape of the Earth’s orbit—the plate—changes from a nearly perfect circle to an oval shape on a 100,000-year cycle (eccentricity). Also, if you drew a line from the plate up through the Earth’s North and South Poles—Earth’s axis—the line would not rise straight up from the plate. Instead the axis is tilted, and the angle of the tilt varies between 22 and 24 degrees every 41,000 years (obliquity). Finally, the Earth wobbles on its axis as it spins. Like the handle of a toy top that wobbles toward you and away from you as the toy winds down, the “handle” of the Earth, the axis, wobbles toward and away from the Sun over the span of 19,000 to 23,000 years (precession). These small variations in Earth-Sun geometry change how much sunlight each hemisphere receives during the Earth’s year-long trek around the Sun, where in the orbit (the time of year) the seasons occur, and how extreme the seasonal changes are. |
Sea-floor sediments, ice sheets, corals, cave formations, ancient trees, and alpine glaciers all hold clues to past climates. Scientists have assembled a coherent picture of the Earth’s climate history by combining data from all these and other sources. [Photographs copyright (left to right) Woods Hole Oceanographic Institute, Reto Stöckli, National Oceanic and Atmospheric Administration, National Park Service, Jessica Bray, and Robert Simmon.] | ||
 |

In the early 1900s, a Serbian mathematician named Milutin Milankovitch meticulously calculated the amount of sunlight each latitude received in every phase of Earth’s orbital variations. His work culminated in the 1930 publication of Mathematical Climatology and the Astronomical Theory of Climate Change. He theorized that the ice ages occurred when orbital variations caused the Northern Hemisphere around the latitude of the Hudson Bay and northern Europe to receive less sunshine in the summer. Short, cool summers failed to melt all of the winter’s snow. The snow would slowly accumulate from year to year, and its shiny, white surface would reflect more radiation back into space. Temperatures would drop even further, and eventually, an ice age would be in full swing. Based on the orbital variations, Milankovitch predicted that the ice ages would peak every 100,000 and 41,000 years, with additional “blips” every 19,000 to 23,000 years. |
Three variables of the Earth’s orbit—eccentricity, obliquity, and precession—affect global climate. Changes in eccentricity (the amount the orbit diverges from a perfect circle) vary the distance of Earth from the Sun. Changes in obliquity (tilt of Earth’s axis) vary the strength of the seasons. Precession (wobble in Earth’s axis) varies the timing of the seasons. For more complete descriptions, read Milutin Milankovitch: Orbital Variations (Diagrams by Robert Simmon.) | |
 |
The paleoclimate record shows peaks at exactly those intervals. Ocean cores showed that the Earth passed through regular ice ages—not just the 3 or 4 recorded on land by misplaced boulders and glacial loess deposits—but 10 in the last million years, and around 100 in the last 2.5 million years. |
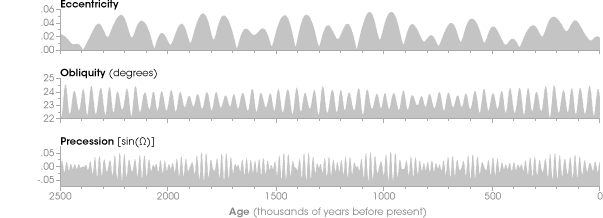
The Earth’s orbit varies over tens and hundreds of thousands of years. Combined changes in eccentricity, obliquity, and precession alter the strength and location of sunlight falling on the Earth’s surface. (Graphs by Robert Simmon based on data from Berger 1992.) |
 |
Evidence supporting Milankovitch’s theory of the precise timing of the ice ages first came from a series of fossil coral reefs that formed on a shallow ocean bench in the South Pacific during warm interglacial periods. As the ice ages came, more and more water froze into polar ice caps and the ocean levels dropped, leaving the reef exposed. When the ice melted, the ocean rose and warmed, and another reef formed. At the same time, the peninsula on which the reefs formed was steadily being pushed up by the motion of the Earth’s shifting tectonic plates. Today, the reefs form a visible series of steps along the shore of Papua New Guinea. The reefs, the age of which was well-defined because of the decaying uranium in the coral, measured out the millennia between ice ages. They also defined the maximum length of each ice age. The intervals fell exactly where Milankovitch said they would. |
(Upper graph) The rise and fall of the intensity of sunlight (insolation) in the far North during the summer—determined by the Earth’s orbit—drives ice ages. Weak summer sunlight year after year allows snow to accumulate and glaciers to advance. The reflective ice sheets further cool the Earth’s surface, resulting in global ice ages. When the Northern Hemisphere receives more sunlight, the snow melts, ice sheets retreat, and Earth warms. (Lower graph) Oxygen isotopes trapped in ocean sediments record cycles of ice ages millions of years into Earth’s past. This climate record matches the frequency of orbital changes, although tangled feedbacks make the relationship complex. Dips represent ice ages, and spikes represent interglacials. (Graph by Robert Simmon, based on data from Berger 1992 and Lisiecki 2005.) |