Tracking down a mistake |
|||
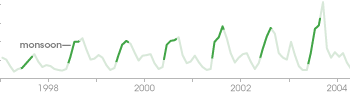
To figure out what had gone wrong, Goés and his colleagues had to double check each piece of information that had gone into making the nitrate maps—like checking a string of holiday lights for the burned-out bulb that is shorting out the whole string. The first “bulb” they checked was chlorophyll. “Since our maps relied on chlorophyll,” Goés explained, “the first thing we checked out was what the chlorophyll data showed. We wondered if it was also very high. We analyzed the chlorophyll observations collected by satellites over the Arabian Sea all the way back to about 1997, and we realized that there was over a 350 percent increase in chlorophyll concentration in the Arabian Sea in 7 years!” |
|||
 | |||
The chlorophyll signal detected by satellites comes from the phytoplankton that grow in the surface waters of the ocean. A 350 percent increase in chlorophyll meant that phytoplankton populations had skyrocketed in the previous 7 years. |
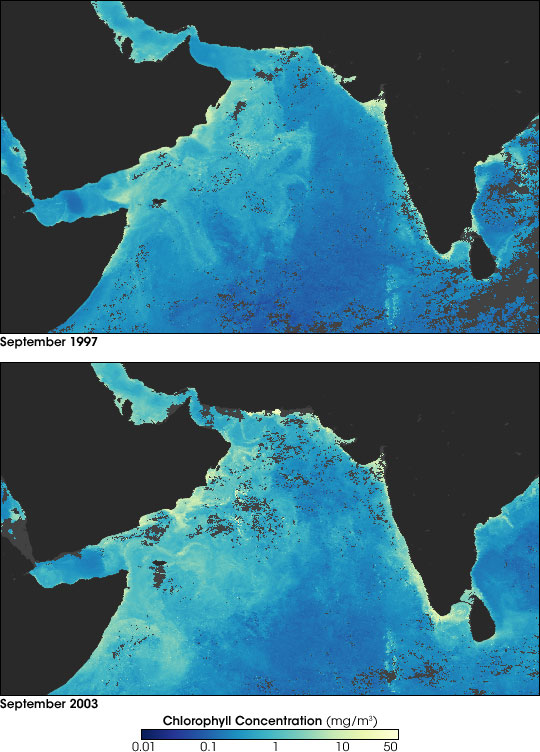
Between 1997 and 2003, chlorophyll concentrations in the Arabian Sea rose 350 percent. In the maps above, high chlorophyll concentrations are yellow, while low concentrations are dark blue. (Maps by Robert Simmon, based on data provided by the NASA GSFC Ocean Color Team) This graph shows seasonal cycles of chlorophyll (milligrams per cubic meter) in the Arabian Sea. Dark green segments show the concentrations measured during the heart of the summer monsoon. (Graph by Robert Simmon, based on data provided by the Bigelow Laboratory for Ocean Sciences) | ||
 |
Goés and his colleagues were intrigued. “That discovery got us looking for causes,” he explained. The first thing they checked was sea surface temperatures because in many parts of the ocean, phytoplankton growth rates are linked to water temperatures. Cool waters are often more productive than warm waters. Phytoplankton grow in the surface waters of the ocean where there is light for photosynthesis, but with so much life concentrated in the surface waters, nutrients eventually become scarce. Growth subsides until a fresh source of nutrients arrives. Often the fresh source of nutrients is water rising up from the depths of the ocean, where the bodies of millions of sea creatures and all the nutrients they contained accumulate over time. Because the water is from deep in the ocean, it is also cold. Pockets of cool sea surface temperatures show where deep water has welled up to the surface. |
||
 |
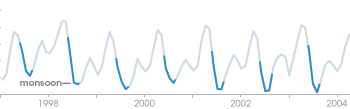
“We went back and looked at the sea surface temperature data for the same 7-year period, and we discovered that temperatures had gotten cooler,” he said. The cool water was especially pronounced along the coast of Somalia, a well-known area of coastal upwelling. The unusually cool temperatures in that part of the sea suggested that upwelling of deep water had increased. Now Goés needed an explanation for the increased upwelling. |
Chlorophyll concentrations in the Arabian Sea increased while sea surface temperatures decreased. This graph shows seasonal cycles in temperatures in the Arabian Sea from 1997 to mid-2004. Dark segments mark the observations collected during the heart of the summer monsoon. Falling temperatures indicate more upwelling of cold, deep water. (Graph by Robert Simmon, based on data provided by the Bigelow Laboratory for Ocean Sciences) | |
