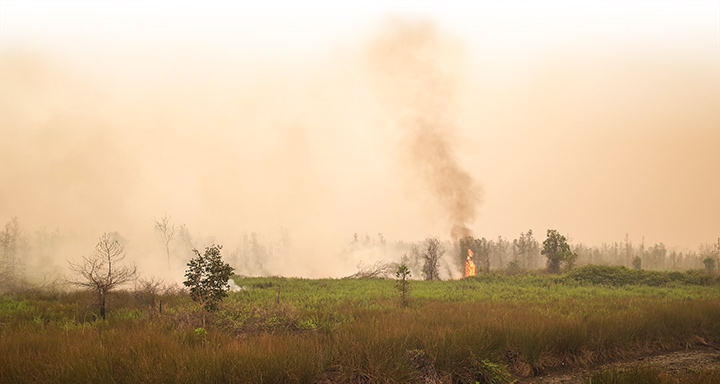
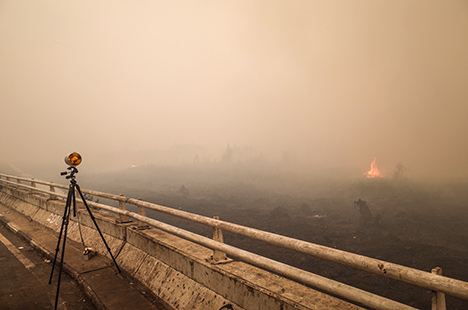
Some growers in Indonesia use fire to clear forests to make way for fields and to burn away old crop debris. In 2015, many fires burned out of control because of unusually dry weather associated with El Niño. (Photo by Martin Wooster.)
In September and October 2015, tens of thousands of fires sent clouds of toxic gas and particulate matter into the air over Indonesia. Despite the moist climate of tropical Asia, fire is not unusual at this time of year. For the past few decades, people have used fire to clear land for farming and to burn away leftover crop debris. What was unusual in 2015 was how many fires burned and how many escaped their handlers and went uncontrolled for weeks and even months.
To study the fires, scientists in Indonesia and around the world have been using many different tools—from sensors on the ground to data collected by satellites. The goal is to better understand why the fires became so severe, how they are affecting human health and the atmosphere, and what can be done to prepare for similar surges in fire activity in the future.
In the darkest days of 2015, the smoke was so thick over Indonesia that satellite sensors like the Moderate Resolution Imaging Spectroradiometers (MODIS) on NASA’s Terra and Aqua satellites could barely see the lush tropical forests and expanses of cultivated land below. On many days, they saw acrid gray clouds of smoke hanging over Sumatra and Kalimantan (southern Borneo) instead.
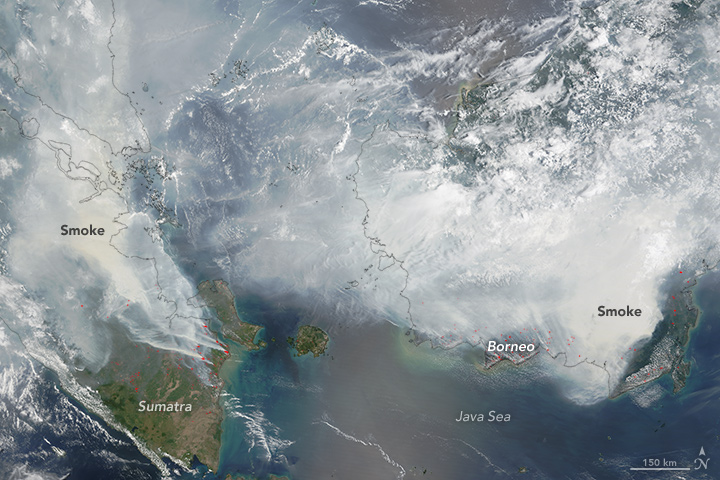
Heavy smoke blanketed Sumatra and Borneo in September and October 2015, as observed by NASA’s Terra satellite. (NASA image by Jeff Schmaltz, LANCE/EOSDIS Rapid Response.)
On the ground, measurements from air pollution sensors were off the charts. In parts of southern Sumatra and Borneo, Indonesia’s Pollutant Standards Index (PSI)—which incorporates particulate matter, sulfur dioxide, nitrogen dioxide, carbon monoxide, and ozone—soared above 2,000. Any score above 350 is considered hazardous to human health.
NASA maintains a global network of ground sensors—AERONET—that helps validate satellite measurements of airborne particles, or aerosols. A station in Palangkaraya, one of the most severely affected cities in Borneo, detected a six-fold increase in particles compared to the usual levels for September and October. “We have never seen such a persistently high value from any of our AERONET sites for such a long period,” said Brent Holben, a scientist at NASA’s Goddard Space Flight Center.
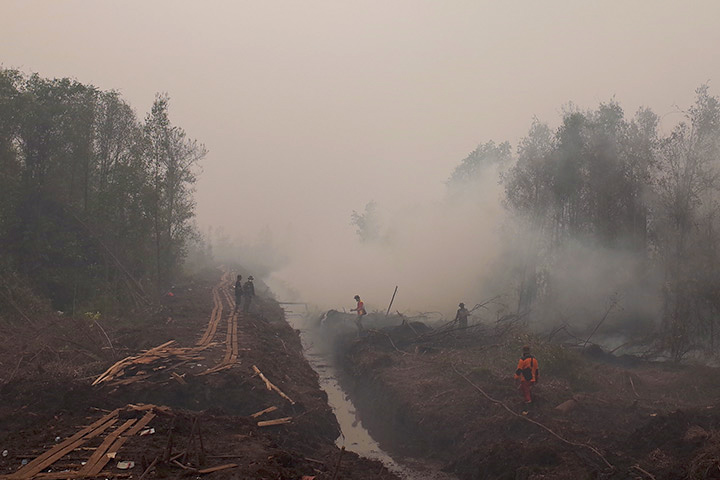
In many areas, drainage canals have lowered the water table enough to make peat swamp forests susceptible to fires. In the absence of human activity, Indonesia’s climate is wet enough that wildfires would not occur. Here, workers respond to fire near a drainage canal as smoke obscures trees in the background. (Photo by Martin Wooster.)
Government authorities and people on the street did what they could to respond to the dangerous air quality. Schools were shuttered. Some people stayed indoors and wore masks when they ventured outside. The Indonesian navy sent ships to smoke-affected provinces to serve as backup evacuation centers. A spokesperson for Indonesia’s Meteorology, Climatology, and Geophysics Agency called the fires “a crime against humanity.” The mayor of Pekanbaru, a city in Sumatra, issued an order to evacuate infants younger than six months to a town hall that had been outfitted with air filters, cribs, and air conditioners.
By the time monsoon rains arrived in late October and many of the fires were quenched, government sources reported 19 pollution-related deaths. Some 500,000 people suffered respiratory problems, and more than 43 million were exposed to unusually high levels of smoke.
Given the moist climate of Indonesia, you would think fires could rarely burn out of control. The tropical nation is rich with rainforests, swamps, and bogs wet enough to suppress fire. Yet in recent decades, these ecosystems have been dramatically altered by human activity. In many places, networks of drainage canals have dried out the wetlands and lowered the water table. The canals are often the first step in a multi-year process designed to transform swamps and forests into farmland.
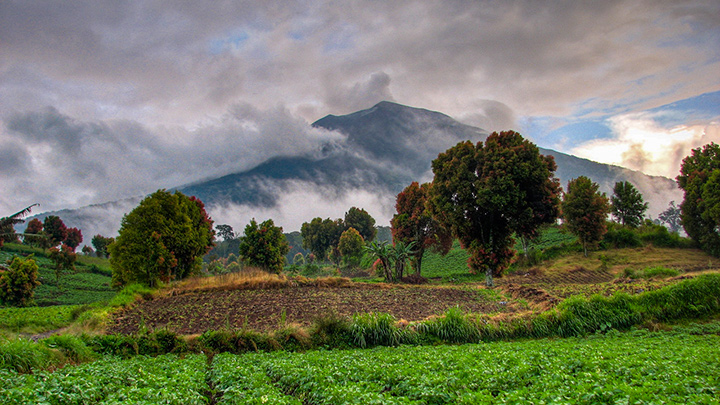
Crops and lush vegetation thrive around Mount Kerinci. Fire is mostly a manmade problem in this tropical environment. (Photo by Buitenzorger, adapted under a Creative Commons license.)
The second step is usually fire. Most fires in Indonesia are set for agricultural purposes—mainly to clear land or fertilize the soil for future plantings. There are other ways to clear land, but none as cheap and quick as burning. In some cases, small-scale sustenance farmers engage in slash-and-burn agriculture. In others, industrial-scale farm operators or mid-sized landowners light fires to clear the way for palm oil, wood pulp, and rubber harvesting.
By comparing satellite observations of fires with land cover data from Indonesia’s department of forestry, Columbia University’s Miriam Marlier found that 41 percent of fire emissions in Sumatra come from lands managed by either the oil palm, timber, or logging industries. In Kalimantan (Borneo), 27 percent of fire emissions come from these industries.
“We do not have the numbers for the 2015 fires yet, but pinning all the blame on large plantations operated by the oil palm industry, as is often done, is an oversimplification,” said Ruth DeFries, one of the scientists involved in the research. The expansion of small-scale agriculture (plots smaller than 2 hectares) and of small to medium-sized (larger than 100 hectares) commercial plantations also contributes significantly to smoke emissions.
In most years, growers keep the fires under control. But 2015 was anything but normal. An unusually strong El Niño has been developing in the Pacific Ocean, and as a result, weather patterns shifted in ways that made Indonesia’s dry season even drier.
Satellite observations of rainfall over Indonesia, captured by the Global Precipitation Measurement (GPM) mission, reveal the diminished rainfall during the fire season. Plenty of rain fell in northern Sumatra in September, but almost none fell over southern Sumatra. The same was true of Borneo: rain fell in Malaysia, while Central and South Kalimantan were dry.
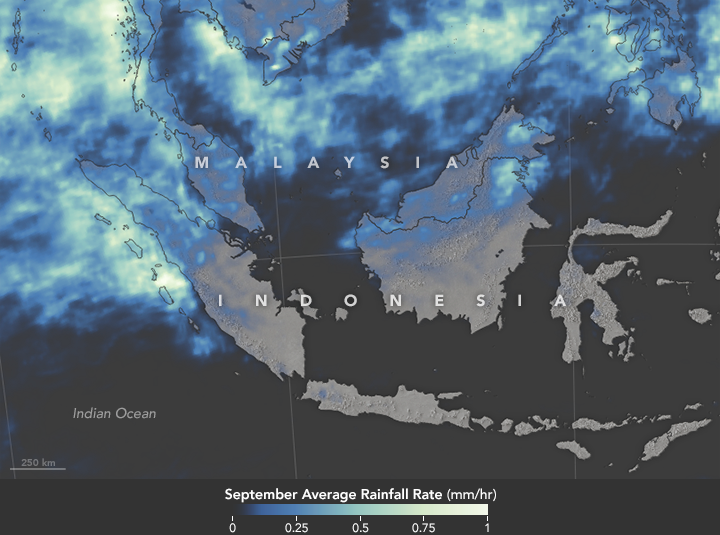
Rainfall was relatively sparse in southern Sumatra and Borneo during September 2015. Bright colors represent areas that received the most rainfall. (NASA Earth Observatory map by Joshua Stevens and Jesse Allen, using IMERG/Global Precipitation Mission data.)
Meanwhile, the troubles in Indonesia extended below the lush land surface. Coastal Sumatra and Borneo are home to some of the most extensive tropical peat deposits in the world. Peat is a soil-like mixture of partly decayed plant material that builds up in wetlands, swamps, and partly submerged landscapes.
Since peat forms mostly underwater, the carbon in plant material is not broken down by oxygen-dependent bacteria, which normally release carbon dioxide from soils back into the atmosphere. Instead, peat acts like a sponge for carbon. In the tropics, underground peat soils store about ten times as much carbon as the above-ground ecosystems. Collectively, the world’s peatlands are believed to hold about 500 billion metric tons of carbon; Indonesia’s peat swamp forests store about one-sixth of that carbon.
But when swamps with underlying peat are drained, the bacterial communities shift. The peat begins to emit carbon dioxide into the atmosphere as it decomposes, and burning dried peat greatly accelerates the process. According to Vrije Universiteit Amsterdam scientist Guido van der Werf, peat fires release three times as much carbon monoxide and ten times as much methane as savanna or grassland fires. Peat fires also tend to burn at low temperatures and can smolder underground, so they are notoriously difficult to extinguish, sometimes burning for months.
For all of these reasons, the climate consequences of Indonesia’s fires pile up quickly. According to van der Werf’s analysis of Indonesia’s emissions, the 2015 fires released 1.75 billion tons of greenhouse gas equivalents—more than Japan emits in a year. On the worst days, the Indonesian fires emitted as much or more carbon as all of the economic activity in the United States generates on an average day.
The MODIS instruments capture images of nearly all of Earth’s surface every day. With their mid-infrared and thermal bands, these sensors can detect hot spots caused by active fires. In 2015, the two sensors detected more than 120,000 hot spots in Indonesia—more than they did during any other year over the past decade.
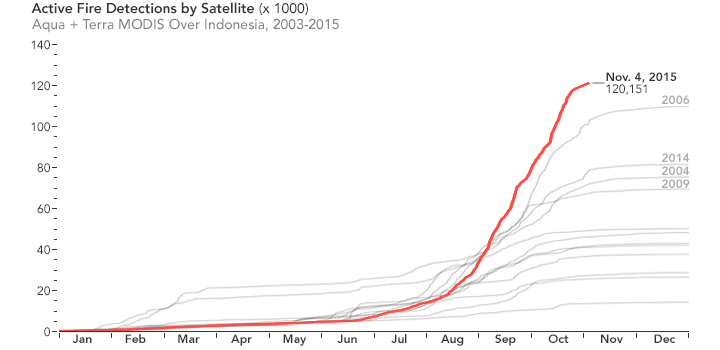
Satellites detected more fires in Indonesia in the first nine months of 2015 than they had detected in any full year since 2003. (NASA Earth Observatory chart by Joshua Stevens, using MODIS-derived fire detection data from the Global Fire Emissions Database.)
“Active fire counts from MODIS have provided an excellent way of systematically tracking fire locations in Indonesia,” said Robert Field, a climatologist at NASA’s Goddard Institute for Space Studies. “Ground and aircraft-based reporting, like we have in North America, is still limited in Indonesia.”
But detecting fire from space with imagers is not always easy. Smoke or clouds can impair an instrument’s ability to sense fires on the surface. And low-temperature or smoldering, underground fires, which are common in Indonesia, sometimes cannot be detected at all.
“Getting the right sensors on the ground is also critical in this part of the world,” said Ellsworth Welton, the principal investigator for NASA’s Micro Pulse Lidar Netork, a global network of ground-based cloud and aerosol sensors. “Clouds over Southeast Asia are quite dense, so even with multiple satellite platforms, the weather can still pose a real obstacle.”
Other types of sensors can help flesh out the story of fire, smoke, and their impacts. For instance, the Cloud-Aerosol Lidar with Orthogonal Polarization (CALIOP) on the CALIPSO satellite and the Multi-angle Imaging SpectroRadiometer (MISR) can measure the height of smoke plumes. CALIOP does this by reflecting laser pulses off the land surface and determining how long it takes for reflected and back-scattered light to return to the sensor. MISR does so by imaging the smoke with nine cameras pointed at different angles.
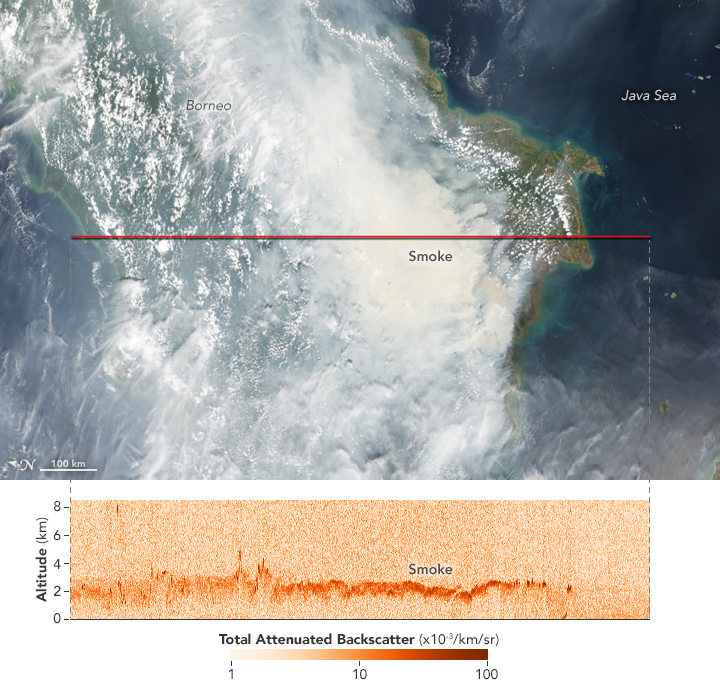
Knowing the altitude of smoke in the atmosphere helps meteorologists predict where and how far winds will carry the plumes. The CALIPSO satellite uses lidar to build a backscatter profile of smoke particles and clouds in the air. (NASA Earth Observatory image by Jesse Allen, using data from the CALIPSO team and MODIS data from the Level 1 and Atmospheres Active Distribution System (LAADS).)
Knowing the height of a smoke plume is critical for atmospheric scientists and meteorologists as they develop models to predict where smoke will blow, explained Michael Tosca, an atmospheric scientist at NASA’s Jet Propulsion Laboratory. In many parts of the world, fires can loft smoke 5 or more kilometers (3 miles) into the air, and occasionally as high as 10 kilometers. But Tosca has found that smoke from Indonesian fires often remains relatively low in the atmosphere—between the surface and 3 kilometers.
When Tosca reviewed MISR and CALIPSO data from September and October 2015, he found that the recent plumes in Indonesia fit this pattern. CALIPSO showed that a large smoke plume over central Kalimantan on October 4, 2015, reached 2 kilometers. During some overpasses, MISR observed thick smoke layers even closer to the surface. (Note, however, that MISR makes measurements over Indonesia in the morning, before sunlight has had much time to heat the ground and drive convection and updrafts.)
Although smoke from Indonesian fires does tend to remain fairly low, some smoke does get caught up with faster-moving, upper-level winds capable of transporting it across Southeast Asia. “These winds tend to push the smoke in a northwesterly direction toward Malaysia, Singapore, southern Thailand, southern Cambodia, and Vietnam, where the impacts on air quality can be severe,” Tosca said. In 2015, the influx of smoke elevated particulate levels to dangerous levels in Malaysia and Singapore, prompting authorities to close schools on multiple occasions.
Satellites also can reveal key characteristics of smoke. The same multi-angle views that allow MISR to estimate plume height also allow it to observe the size, shape and, in some cases, the brightness of the tiny particles in that smoke. Most wildfire smoke tends to be dominated by small, spherical, and dark-colored particles. Atmospheric scientists generally call this “black carbon” because of how it readily absorbs light. However, the smoke cloud over Indonesia in 2015 had particles that were relatively large. In a tropical environment like Indonesia, smoke particles encounter high humidity even in the dry season, explained Ralph Kahn, a senior research scientist at NASA’s Goddard Space Flight Center. “When they do, the particles absorb the water and expand.”
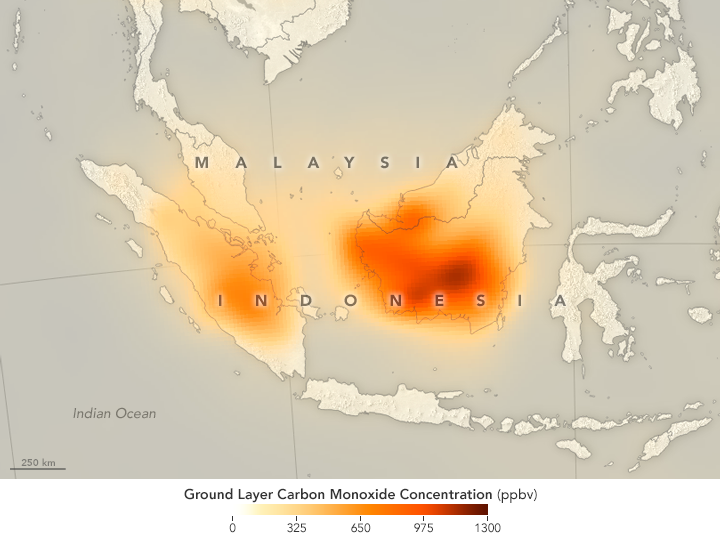
Satellite data from the MOPITT instrument show carbon monoxide levels over Indonesia and Malaysia in September 2015. Fires generate an abundance of carbon monoxide, an odorless, colorless, and poisonous gas. (NASA Earth Observatory map by Joshua Stevens and Jesse Allen, using data from the MOPITT Teams at the National Center for Atmospheric Research and the University of Toronto.)
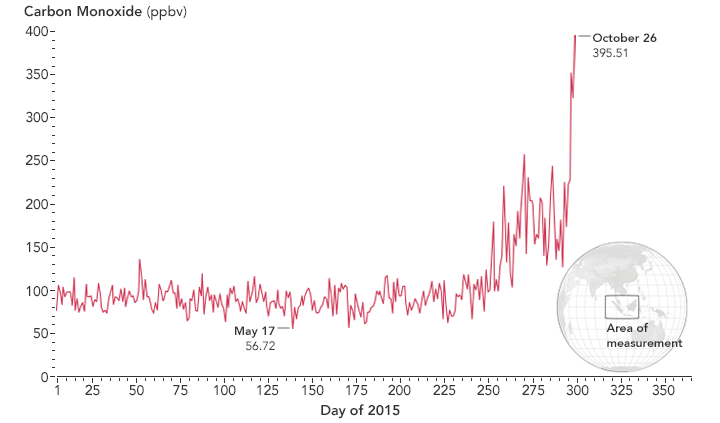
Other sensors can study gases that are invisible to human eyes. The Measurement of Pollution in the Troposphere (MOPITT) sensor on Terra can detect carbon monoxide, an odorless, colorless, and poisonous gas that is abundant in peat fires. When inhaled, carbon monoxide reduces the amount of oxygen that blood can deliver to the body’s organs, including the heart and brain.
“The 2015 Indonesian fires produced some of the highest concentrations of carbon monoxide that we have ever seen with MOPITT,” said Helen Worden, a scientist at the National Center for Atmospheric Research. Average carbon monoxide concentrations over Indonesia are usually about 100 parts per billion. In some parts of Borneo in 2015, MOPITT measured carbon monoxide concentrations at the surface up to nearly 1,300 parts per billion.
Carbon monoxide levels spiked even at higher altitudes (9 kilometers), as detected by the Microwave Limb Sounder. (NASA Earth Observatory chart by Joshua Stevens, using MLS data courtesy of Robert Field, NASA GISS/Columbia University.)
All of that carbon monoxide did not stay at Earth’s surface. The Atmospheric Infrared Sounder (AIRS) observed significant concentrations of carbon monoxide about 5 kilometers above the surface. Another sensor, the Microwave Limb Sounder (MLS), detected elevated levels of carbon monoxide at upwards of 9 kilometers in late October. The gas was likely lofted up by convection from incoming monsoon storms and rain.
Beyond understanding the fires and their effects on the atmosphere, other scientists and conservation groups are mining satellite data in order to reduce the use of fire. The World Resources Institute and World Wildlife Fund Indonesia both maintain online tools to overlay active fire data from NASA satellites with other layers of data—such as the locations of conservation lands and areas designated for oil palm, pulp wood, and logging. These tools have been used to pinpoint companies or individuals that light fires illegally.
During the worst of the fires, severely decreased visibility made driving hazardous and led to the cancellation of many flights. (Photo by Martin Wooster.)
However, some researchers caution against using satellite observations alone to assign blame for particular fires. A tangle of national, provincial, and tribal laws can lead to confusion over who owns a given parcel of land, explained David Gaveau, a remote sensing scientist with the Center for International Forestry Research.
In some cases, Gaveau and colleagues have merged satellite data and investigations on the ground to arrive at counterintuitive findings. For instance, after fires in 2014, Gaveau used imagery from Landsat 8, along with ground-based investigations of burn sites, to show that two fires in Sumatra that had burned on large commercial plantations either started outside of the plantations and burned their way in, or they began on land occupied by small-scale farmers within the plantations.
“While our analysis should not be read as completely absolving companies—as companies have in the past used fire to clear land—it does show that the situation on the ground is more complex than is often portrayed,” noted Gaveau in a blog post.
Meanwhile, Field and researchers at Columbia have yet another goal: minimizing the damage from future fire seasons. They are developing and promoting new weather and fire forecasting capabilities that could help Indonesians better manage the use of fire.
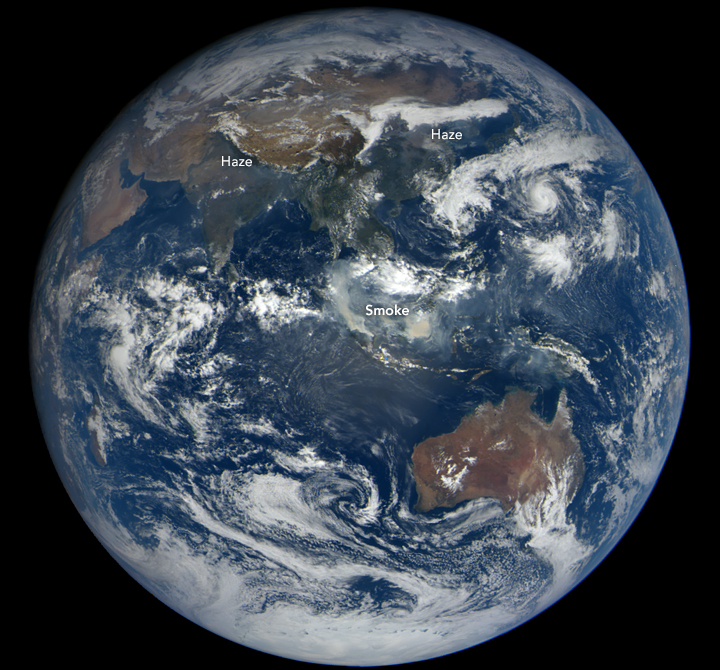
The impact of Indonesia’s fires was felt across tropical Asia. On October 21, 2015, the Earth Polychromatic Imaging Camera aboard the DSCOVR satellite acquired this view of smoke drifting over the region. (NASA image courtesy of the DSCOVR EPIC team.)
In 2015, meteorologists and climatologists knew that dry weather was coming well before it arrived; this was largely due to El Niño conditions. “There was at least a one-month window when preparedness measures could have been taken before the situation deteriorated in August,” said Field. “Early warning systems will not address underlying socioeconomic causes of the fire, of course, but the need for systematic early warnings is urgent. The science is maturing to the point where we have a real opportunity to start responding to forecasts rather than to crises.”
