
Watching a Changing Planet | |||
James Hansen heads NASA’s Goddard Institute for Space Studies (GISS) at Columbia University in New York. In the mid-1970s, he was studying clouds on Venus when he fielded a request for help in studying the greenhouse effects of trace gases—gases that exist in miniscule amounts but that may still have significant climatic effects. About that time, Hansen’s research interests shifted away from Venus and closer to home. “A planet that is changing on timescales that people are going to notice is a more interesting planet, and it obviously has more social relevance,” he says. |
|||
After shifting his research focus in the mid-1970s, Hansen spent more than a decade studying the effects of greenhouse gases on Earth’s climate. His research covered the effects of volcanic eruptions and aerosols (tiny liquid or solid particles suspended in the air), solar variability, increasing carbon dioxide, and increasing trace gases. He also studied atmospheric circulation, the sinking of surface water down into the deep ocean in the North Atlantic, and global trends in both sea level and surface air temperatures. He developed three-dimensional models of global climate. In 1988 Hansen testified before Congress, describing how different levels of greenhouse gases might affect future temperatures. Over the next 17 years, observed temperatures closely agreed with Hansen’s 1988 predictions. But are recent temperature changes really from human-triggered global warming, or could they just be coincidence? The way to find out, Hansen explains, is to look at the planet’s overall energy budget. If increasing greenhouse gases are exerting pressure on the planet’s climate, the gases should create an energy imbalance in which the Earth absorbs more energy than it radiates back to space. Because most of the planet is ocean-covered and because those oceans have a high heat capacity, excess energy should show up in the ocean. So when Hansen saw Willis’s paper on ocean warming, he sent an e-mail suggesting that they collaborate on a new study. “Josh Willis’ paper spurred my colleagues and me to compare our climate model results with observations,” Hansen says. Hansen, Willis, and several colleagues used the global climate model of the NASA Goddard Institute for Space Studies (GISS), which predicts the evolution of climate based on various forcings—conditions or events that can cause climate change, such as water vapor and greenhouse gases, changes in solar radiation, or volcanic eruptions. |

James Hansen has studied Earth’s climate since 1976. (Photo courtesy Goddard Institute for Space Studies.) | ||
 | |||
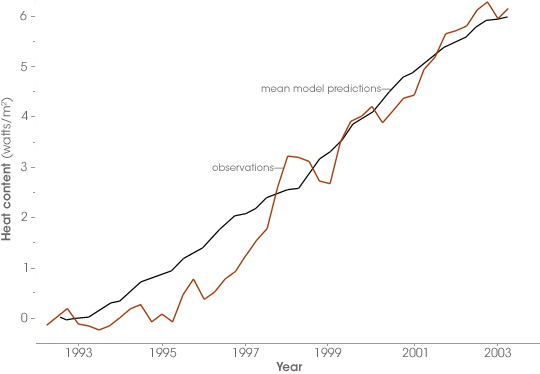
Hansen and his collaborators ran five climate simulations covering the years 1880 to 2003 to estimate change in Earth’s energy budget. Taking the average of the five model runs, the team found that over the last decade, heat content in the top 750 meters of the ocean increased by 6.0 plus or minus 0.6 watt-years per square meter. (A watt year is the amount of energy delivered by one watt of power over one year.) What kind of energy imbalance would it take to generate that much heat? The models predicted that as of 2003, the Earth would have to be absorbing about 0.85 watts per square meter more energy than it was radiating back into space—an amount that closely matched the measurements of ocean warming that Willis had compiled in his previous work. The Earth, they conclude, has an energy imbalance. “I describe this imbalance as the smoking gun or the innate greenhouse effect,” Hansen says. “It’s the most fundamental result that you expect from the added greenhouse gases. The [greenhouse] mechanism works by reducing heat radiation to space and causing this imbalance. So if we can quantify that imbalance [through our predictions], and verify that it not only is there, but it’s of the magnitude that we expected, then that’s a very big, fundamental confirmation of the whole global warming problem.” |
This graph compares observed (red) and modeled (black) heat content of the ocean between 1993 and 2003. The mean model predictions result from five runs of the NASA GISS ocean-atmosphere model. (Graph derived from Hansen et al. 2005.) | ||