Taking the Ocean’s Temperature | |||
“The ocean’s a big place, and it’s not doing the same thing everywhere,” says Willis. “In some places, it’s warming. In some places, it’s cooling, and the quantity we need is the average over the whole thing.” Getting that average has entailed overcoming several challenges, the biggest of which is probably learning how to take the ocean’s temperature everywhere. “There’s a long history of shipping back and forth between the U.S. and Europe,” Willis explains. As a result, temperatures in the North Atlantic have been studied carefully over the last century. Ships often dropped thermistors—devices that exhibit rapid changes in electrical resistance based on small temperature changes—along their routes. Although this approach yielded excellent temperature records for some areas, it offered far from universal coverage. “The Pacific is a huge ocean, and even if you count all the shipping lanes—the places where people go all the time—there are still big gaps.” Sparsely sampled as it historically has been, however, the Pacific ranks above what Willis calls the “worst place for sampling”: the Southern Ocean. |
|||
 | |||
Global measurements of changes in ocean temperature could only come from satellite. In 1992, NASA and the French Centre National d’Etudes Spatiales launched the TOPEX/Poseidon oceanography satellite; in 2001, they launched the successor, Jason 1. These satellites have provided researchers with global records of sea surface height. “As the water column warms up, the water expands, and that causes a change in the height of the sea surface. A satellite can measure sea-surface height very accurately, and it can cover the globe,” Willis says. The Jason-1 satellite doesn’t work alone. In the ancient Greek myth, the explorer Jason was accompanied by his trusty shipmates, the Argonauts. Reminiscent of that legend, the international Argo float program complements the satellite’s observations. By the end of 2006, the Argo program is expected to operate 3,000 floats, mechanical devices that measure temperature and salinity, drifting at specified depths and spaced roughly every 3 degrees (at the Equator, this equals 360 kilometers). “We haven’t sampled the ocean with direct temperature measurements nearly as much as we probably should, but the Argo floats are starting to provide really good coverage,” Willis remarks. A growing collection of satellite observations and direct temperature measurements of the ocean enabled Willis to try to assess the ocean’s average temperature. “Many, many researchers worked over many, many years” to collect all the data, says Willis. In 2004, he and two colleagues assembled the pieces for a paper published in the Journal of Geophysical Research. Along with satellite data, he incorporated roughly 1 million temperature profiles. “Each profile really includes measurements of temperature with depth between the sea surface and several hundred meters, so there are actually lots of measurements within each of those million profiles,” he explains. |
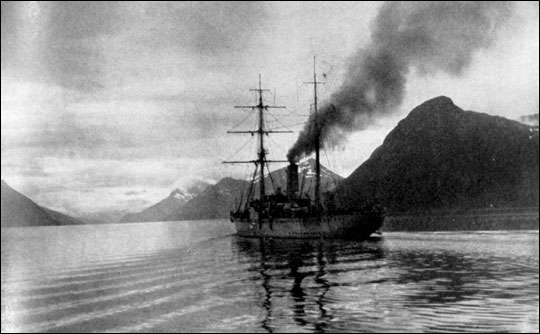
Germany conducted a major oceanographic research project between 1925 and 1927. On the research vessel Meteor, the German Atlantic Expedition measured the temperature, salinity, and density of the surface waters of the Atlantic. The expedition included a trip through the Straits of Magellan. (Photo courtesy NOAA Photo Library.) | ||
 | |||
After combining all the data, Willis found that between mid-1993 and mid-2003, the heat content of the upper 750 meters of Earth’s global ocean increased at an average rate of 0.86 watts (plus or minus 0.12 watts) per square meter. Just 0.86 watts per square meter may not sound like much until you consider that we are talking about an area of about 337 trillion square meters (the 93 percent of the world ocean that Willis studied). He also points out that ocean temperatures actually fall into two categories. “It’s important to make a distinction between warming at different depths. People are most familiar with sea surface temperature because it’s where we live. We live on the Earth’s surface. But a lot of this action and this heat-content signal are really beneath the surface of the ocean, and you have to go to hundreds of meters in depth to measure it. And what’s going on right at the surface and what’s going on at depth can sometimes be different.” Sea-surface temperature is a bigger driver of weather, but ocean temperature at depth tells researchers more about the planet’s energy imbalance. To a climate modeler, a real-world estimate of the ocean’s energy imbalance provides a rare opportunity to test model predictions of how increasing amounts of greenhouse gases are affecting Earth’s climate. Soon after he published his paper, Willis learned he had caught someone’s attention. |
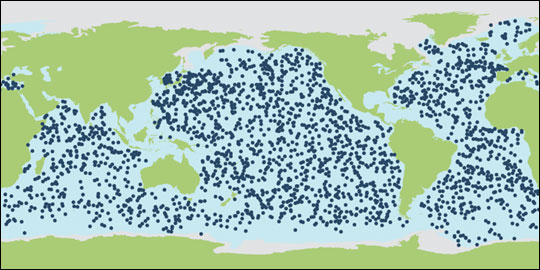
The goal of the Argo float program is to operate 3,000 floats in the world’s ocean. This map shows the distribution of active Argo floats as of March 2006. (Map courtesy The Argo Information Centre.) | ||
