
Scientists have used a variety of methods to survey the world’s forests and their biomass. They have systematically measured forests from the ground, venturing into the woods to count trees, measure trunks, and climb to the top of the canopy. Taking to airplanes, they have made photographic, radar, and lidar surveys of different types of forest.
With satellites, they have collected regional and global measurements of the “greenness” of the land surface and assessed the presence or absence of vegetation, while looking for signals to distinguish trees from shrubs from ground cover.

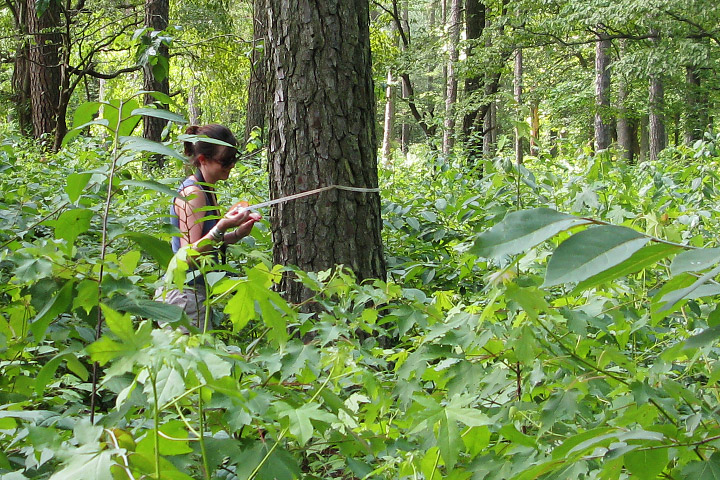
Student Kelly McManus measures the circumference of a tree in a coastal Virginia forest. Ground-based studies are crucial to ensure the accuracy of airborne and satellite-based studies of vegetation. (NASA photograph courtesy Lola Fatoyinbo.)
But to assess biomass, you have to know the area, density and, most importantly, the height of the trees. Researchers have achieved this on small scales, but to use the traditional methods on a global scale is prohibitively expensive and time-consuming.
“We need to see Earth’s vegetation in three dimensions,” says Jon Ranson, a forest ecologist based at NASA’s Goddard Space Flight Center. “By measuring the height of forests, we can then estimate above-ground biomass and estimate the carbon stored in that forest. The more accurate the measurements, the more certain our estimates of the carbon.”
The first map to estimate forest heights on a global scale came in 2010. Michael Lefsky of Colorado State University combined broad views of the horizontal land surface from the Moderate Resolution Imaging Spectroradiometer (MODIS) on NASA’s Terra and Aqua satellites with vertical height from NASA’s Ice, Cloud, and land Elevation Satellite (ICESat).
The height of the world’s forests range from over 40 meters in the U.S. Pacific Northwest, to just under 20 meters for the boreal forests that ring the Arctic. In this map, darker green relates to taller forests. [NASA Earth Observatory map by Jesse Allen & Robert Simmon, using data from Michael Lefsky, Colorado State University].
The result was a map showing the world’s tallest forests clustered in the Pacific Northwest of North America and in portions of Southeast Asia, with shorter forests covering broad swaths across Canada and Eurasia. The tallest tree canopies are the temperate conifer forests—full of Douglas fir, western hemlock, redwood, and sequoia—that often grow taller than 40 meters (131 feet). Boreal forests of spruce, fir, pine, and larch usually reach less than 20 meters (66 feet) into the sky. In the middle are the temperate, broadleaf forests of Europe and the United States and the undisturbed tropical rain forests, which both average 25 meters (82 feet) tall.
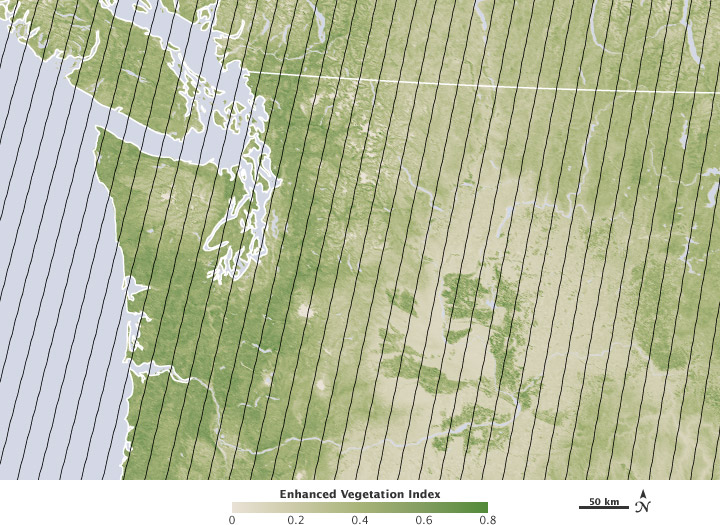
The backbone of the mapping effort was data from the Geoscience Laser Altimeter System (GLAS) on ICESat, which pulsed laser light at the planet’s surface more than 250 million times in its seven years of flight (2003-2009). Those pulses made direct measurements of 2.4 percent of Earth’s forest surfaces and measurements for 24 percent of the forest patches on surface. That left it to Lefsky to extrapolate and to work out mathematical model estimates for the forests surrounding the ICESat samples.

Michael Lefsky combined wide-scale observations of vegetation with precise laser measurements from ICESat, which were taken along narrow tracks (black lines), to construct a map of forest heights. (NASA map by Jesse Allen and Robert Simmon.)
The global map was the first of its kind, but Lefsky and colleagues knew there was still a lot of uncertainty to be cleared up with better instrumentation and coverage. “This is really a first draft,” said Lefsky, “and it will certainly be refined in the future.”