The Earth Observatory has published its last Image of the Day on this website. Please join us on our new home at science.nasa.gov/earth/earth-observatory.
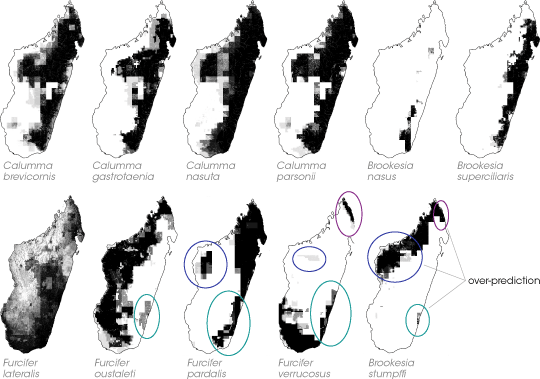
“That the models could do so well even based on such old data was a fantastic result,” says Raxworthy. “For so long, many people had been thinking that those old museum records were never going to be useful for predicting current species distributions because the landscape and habitat had changed so much since those records were collected. Instead we found that we can combine modern environmental data with older specimen data and still get a good general idea about where various chameleons currently live.” The scientists overlaid the results of the ten best models onto a single, shaded map that showed the species’ range. Where the models agreed with one another, the shading would be darker, where they didn’t agree, the shading would be lighter. But just when Raxworthy thought he had the best models the computer could make, he noticed something a little strange: in four of the eleven species range maps, the computer seemed to be “over-predicting.” It was saying a species of chameleon existed somewhere that he and the other scientists were pretty sure it didn’t. |
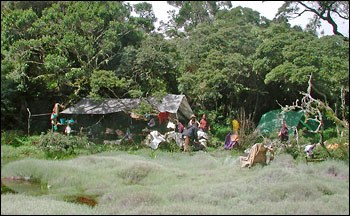
To evaluate the species prediction models, scientists camped out in the field while searching for chameleons at eleven new sites around Madagascar. The models correctly predicted which species would and would not be found at the new sites 85 percent of the time. (Photograph courtesy Chris Raxworthy) |
||
 |
|||
Raxworthy explains what it was like to look at those first results. “We had this model output—a shaded map of a species range—that basically lined up with what we knew about where a species was distributed. But then we had another area identified that might be 100 kilometers away—sometimes in a completely isolated area.” Raxworthy and his team puzzled over the results for several weeks. “We’d just keep coming back to the maps, showing them around to folks, trying to figure out what could be wrong with the model.” After a time, he says, he noticed that for the four species with models that over-predicted, every questionable area in one model overlapped a questionable area of at least one—and sometimes all—other models. In other words, when the species predictions seemed wrong, they were wrong in the same place. Raxworthy thought that the overlap must be significant. What could it mean when the models said that an isolated area in southeast Madagascar ought to be home to four different species of chameleon that the scientists were pretty sure didn’t actually live there? |
For each species, scientists combined the results of the ten-best computer models on a single shaded map. The maps are darker where the models agreed with one another, indicating increasing probability of finding the species in that location. For four species, the models persistently predicted that the species lived in areas where no specimens had ever been documented before (bottom row, colored ovals). Interestingly, a questionable area in one species model always overlapped at least one questionable area from a different species model. For example, models predicted that the range of both Furcifer verrucosus and Brookesia stumpffi (bottom row, first and second maps from right) would include the northeastern shore of the island, even though scientists suspected otherwise. What could it mean that when the models seemed “wrong,” many of them in the same place? (Maps adapted from Raxworthy et al. 2003) |
||
