Satellites Reveal a Browning Forest |
|||
These were not the questions that Goetz set out to answer when he began his analysis of satellite imagery of the Northern forests of North America. He had wanted to know how the forests use carbon dioxide as they recover from fire so he could determine the impact of fire on the carbon cycle. As Goetz expected, the satellite data showed that the newly burned forest was “greening up” as it recovered to pre-burn conditions. But in the surrounding unburned forest, growth was slowing down, and that surprised Goetz. “Earlier work suggested greening in the Northern Hemisphere and an increase in the growing-season length,” says Goetz. |
|||
He decided to take a closer look at the unburned forest, enlisting the help of Woods Hole colleagues Andrew Bunn, an ecologist with experience tracking change in the forests, and Richard Houghton, a senior scientist and carbon expert who had spent years studying the global carbon budget. The group studied data collected by the Advanced Very High Resolution Radiometer (AVHRR) series of satellite sensors, which have been in orbit since 1981. When sunlight hits the surface of the Earth, some of it bounces back into space, and this is what the satellites measure. “Plants reflect light depending on how fast or how much they are growing,” says Bunn. “The different light that they reflect depends on how green they are and how much photosynthesis is happening. By measuring that greenness, we can infer how much production is happening.” Production, he explains, is how much carbon plants take out of the atmosphere and turn into organic material like leaves and stems through photosynthesis. To measure forest “greenness” with satellite data, scientists often create a low-to-high vegetation scale, or index. The Global Inventory Mapping and Monitoring (GIMMS) group at NASA Goddard Space Flight Center has produced such vegetation index maps for every 15-day period that the AVHRR sensors have been in space. To track the change in Northern forests’ greenness, Goetz and research assistant Greg Fiske gathered all of the 15-day vegetation index maps that the GIMMS group had produced for 1981 to 2003. “We stacked all the 15-day periods on top of each other and looked at how each point in space was changing over time,” explains Bunn. The trend that emerged revealed a browning forest. “I was surprised,” says Goetz. “We looked at it a couple of times. In fact, we reprocessed the data twice and then a third time to be sure.” It was no mistake; the forest was browning, but only in interior Alaska and Canada. “When we started to look at a much larger area, we saw that the tundra areas continued to green, where the forest areas were in decline.” |
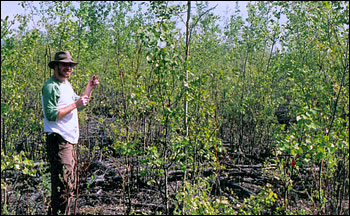
Dan Steinberg, a member of Goetz’s team, stands in a boreal burn scar. Scott Goetz and his colleagues first noticed changes in the health of the boreal forest while studying burn scars. While burned areas regrew as scientists expected, growth slowed in the surrounding unburned land. (Photograph copyright Daniel Steinberg, Woods Hole Research Center.) | ||
 | |||
But why were the forests in decline? Scientists have always thought that plant growth in the boreal forests was limited by temperature. Arctic summer provides a brief period in which plants can thrive before the cold of winter ends the growing season. If temperatures had warmed, extending the growing season, then plants should have been able to grow more. But Goetz and his colleagues suspected that warmer temperatures had also dried the forest. “Most people wouldn’t think of these boreal forests as being drought stressed,” says Goetz. “There is often a lot of surface moisture in wet areas, but if the air is very dry, conifers tend to be pretty strongly affected. Photosynthetic rates are reduced when the air is dry, particularly in these high-latitude forests adapted to cooler conditions.” Although drought would cause the same kind of browning that Goetz and his colleagues had observed, they weren’t certain that dryness was the only thing affecting the trees. It was possible that other factors, such as nutrient stress or insect damage, could be to blame. Strong evidence that drought was really to blame would come from a second source. |
From 1982 through 2003, the photosynthetic activity (an indicator of plant growth) of the boreal forest in North America decreased. At the same time, the photosynthetic activity of tundra along the Arctic coast increased. This map shows areas of decreased photosynthetic activity in brown, and increased photosynthetic activity in green. Despite warmer temperatures and a longer growing season, the growth of the forest was slowing down. (Map adapted from Goetz et al. 2005.) | ||
alert message
