Warm Summers Slow Carbon Uptake |
||||||||||||||||||||||||||||||||||||||||||||||||||||||||||||||||||||||||||||||||||||||||||||||||||||||||||||||||||||||||||||||||||||||||||||||||||||||||||||||||||||||||||||||||||||||||||||||||||||||||||||||||||||||||||||||||||||||||||||||||||||||||||||||||||||||||||||||||||||||||||||||||||||||||||||||||||||||||||||||||||||||||||||||||||||||||||||||||||||||||||||||||||||||||||||||||||||||||||||||||||||||||||||||||||||||||||||||||||||||||||||||||||||||||||||||||||||||||||||||||||||||||||||||||||||||||||||||||||||||||||||||||||||||||||||
On the other side of the country, Alon Angert was puzzling over the same question as Goetz: what was happening to Northern forests? Angert, a researcher at the University of California, Berkeley, had been using remote sensing and carbon dioxide measurements to see how the biosphere—life on Earth ranging from plants and animals to soil microbes—was reacting to climate change. “We know that about quarter of the CO2 that humans emit into the atmosphere is taken up by the land biosphere, but we want to know if the biosphere will keep taking up CO2,” he explains. Angert was particularly interested in finding out how the change in season affected the way plants use carbon dioxide. To get an idea of what carbon dioxide levels were on a global scale, he used carbon dioxide levels taken from all ground stations and averaged by latitude, focusing on latitudes above 20 degrees North where seasonality impacts plants the most. Next, he removed the long-term “background” increase in carbon dioxide that has been occurring since the Industrial Revolution to isolate the seasonal increase and decrease caused by the biosphere “breathing.” Then he divided the data into two periods: spring when plants are coming to life and summer when plants are taking up the most carbon dioxide. |
||||||||||||||||||||||||||||||||||||||||||||||||||||||||||||||||||||||||||||||||||||||||||||||||||||||||||||||||||||||||||||||||||||||||||||||||||||||||||||||||||||||||||||||||||||||||||||||||||||||||||||||||||||||||||||||||||||||||||||||||||||||||||||||||||||||||||||||||||||||||||||||||||||||||||||||||||||||||||||||||||||||||||||||||||||||||||||||||||||||||||||||||||||||||||||||||||||||||||||||||||||||||||||||||||||||||||||||||||||||||||||||||||||||||||||||||||||||||||||||||||||||||||||||||||||||||||||||||||||||||||||||||||||||||||||
 |
“What we found is that the spring uptake was very highly correlated with temperature,” Angert says. The warmer the spring temperatures were, the more carbon dioxide the forest absorbed, just as theories had predicted. The trend for the summer was a different story. From 1985-1991, the forest did continue to absorb more and more carbon dioxide as it greened throughout the summer. But then, in 1991, Mount Pinatubo erupted, sending a cloud of sulfate aerosols into the upper atmosphere. The eruption cooled global temperatures for two years, disrupting the trend. When temperatures resumed climbing in 1994, a new trend began to emerge. The forest continued to soak up more carbon dioxide with warmer temperatures in the spring, but in the summer, the trees stopped using as much carbon dioxide. “The biosphere didn’t keep up,” says Angert. “I was surprised,” Angert remarks. Like Goetz and his colleagues, Angert checked his data again. Still seeing the shifting trend, he decided to look at vegetation index data to confirm his observations. Had the forests browned while they slowed their intake of carbon dioxide? After getting the same satellite-based vegetation data from NASA that Goetz and his colleagues used, Angert divided the data into spring and summer periods to match his carbon dioxide observations. He then averaged the vegetation index values by latitude and saw that they echoed the carbon dioxide measurements. In the spring and the summer of the first period, the forests got greener with warmer temperatures. But in the summer of the second period, when he had seen a decrease in the amount of carbon dioxide the biosphere absorbed, the forest got browner. |
Before the eruption of Mt. Pinatubo (yellow block), carbon uptake in Northern forests (blue lines) increased as temperatures increased (green lines) in spring (top graph) and during the entire growing season (March-August, bottom graph). When the cooling period caused by Pinatubo’s emissions ended, global temperatures began to climb again. Increases in temperature continued to boost carbon uptake in the spring, but over the entire growing season, warmer summers caused carbon uptake to decline. The light-colored lines show year-to-year changes, while the darker lines show the overall trend. (Figures adapted from Angert et al. by Robert Simmon.) | ||||||||||||||||||||||||||||||||||||||||||||||||||||||||||||||||||||||||||||||||||||||||||||||||||||||||||||||||||||||||||||||||||||||||||||||||||||||||||||||||||||||||||||||||||||||||||||||||||||||||||||||||||||||||||||||||||||||||||||||||||||||||||||||||||||||||||||||||||||||||||||||||||||||||||||||||||||||||||||||||||||||||||||||||||||||||||||||||||||||||||||||||||||||||||||||||||||||||||||||||||||||||||||||||||||||||||||||||||||||||||||||||||||||||||||||||||||||||||||||||||||||||||||||||||||||||||||||||||||||||||||||||||||||||||
 |
||||||||||||||||||||||||||||||||||||||||||||||||||||||||||||||||||||||||||||||||||||||||||||||||||||||||||||||||||||||||||||||||||||||||||||||||||||||||||||||||||||||||||||||||||||||||||||||||||||||||||||||||||||||||||||||||||||||||||||||||||||||||||||||||||||||||||||||||||||||||||||||||||||||||||||||||||||||||||||||||||||||||||||||||||||||||||||||||||||||||||||||||||||||||||||||||||||||||||||||||||||||||||||||||||||||||||||||||||||||||||||||||||||||||||||||||||||||||||||||||||||||||||||||||||||||||||||||||||||||||||||||||||||||||||||
“When you see the same thing happen in independent data sets, it makes you think that what you are seeing is real,” Angert observes. As an extra check, he put the satellite vegetation “greenness” measurements into a model to estimate how much carbon dioxide was taken from the atmosphere. The model predictions matched what he had seen in the observations of carbon dioxide. Why would the forest head into this decline? Like Goetz, Angert suspected drought. The forest was doing fine in the spring, but by summer had run out of water, and that was causing the browning trend, he theorized. He matched the vegetation index data to the Palmer Drought Index, a measure of drought that compares the amount of water that is available to the amount of water that plants need at certain temperatures. Again he found a match. The forest productivity had decreased when the drought index indicated water shortages.
|
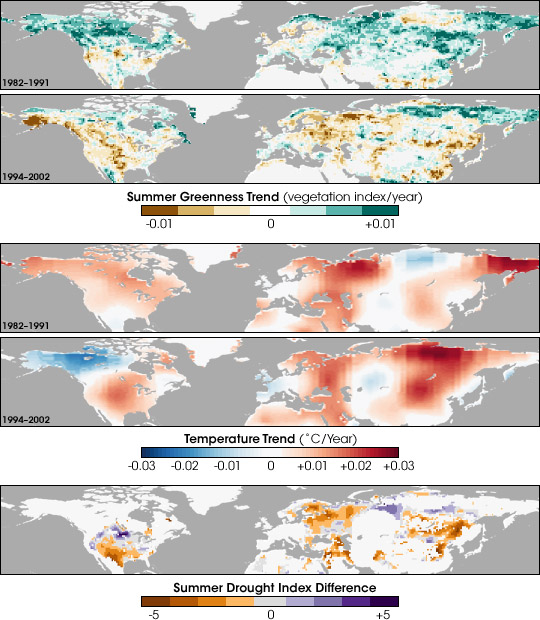
Arctic temperatures warmed about 0.3°C over the past 25 years. During the initial decade of warming, boreal forests responded with vigorous growth. From 1994 to 2002, however, growth in many places slowed as temperatures climbed and the forest dried out. The maps above show trends in greenness, or growth (top pair), temperature (middle), and drought (bottom) from 1982-1991 and 1994-2002. In the earlier decade, increased growth (green) was linked to warmer temperatures (red) across most of the North. In the second decade, most of the area experienced poorer growth (brown) as temperatures rose. A cooling trend (blue) limited growth in Alaska during the latter decade, but the long-term trend in the area is a warming one. A Palmer drought index map shows areas that experienced drier (orange) or wetter (purple) summers. (Maps adapted from Angert et al. by Robert Simmon.) | |||||||||||||||||||||||||||||||||||||||||||||||||||||||||||||||||||||||||||||||||||||||||||||||||||||||||||||||||||||||||||||||||||||||||||||||||||||||||||||||||||||||||||||||||||||||||||||||||||||||||||||||||||||||||||||||||||||||||||||||||||||||||||||||||||||||||||||||||||||||||||||||||||||||||||||||||||||||||||||||||||||||||||||||||||||||||||||||||||||||||||||||||||||||||||||||||||||||||||||||||||||||||||||||||||||||||||||||||||||||||||||||||||||||||||||||||||||||||||||||||||||||||||||||||||||||||||||||||||||||||||||||||||||||||||
