The Earth Observatory has published its last Image of the Day on this website. Please join us on our new home at science.nasa.gov/earth/earth-observatory.
| Mapping Landcover and Fire Extent with Satellite Data |
| ||
From 1993-97, teams of scientists from all over the world participated in the NASA-sponsored Boreal Ecosystem-Atmosphere Study (BOREAS) to examine the physical and chemical interactions that occur between the boreal forest and the lower atmosphere. Among the primary objectives of the experiment were: (1) to improve our understanding of the mechanisms by which carbon is exchanged, and (2) to map the types and geographical distribution of plant species across the Canadian boreal landscape. Ultimately, participating scientists hope the new BOREAS data will help them improve their computer models of the boreal ecosystem so that they can better predict how climate change is likely to affect the northern forests in the future; and how changes in the forest may in turn impact climate. According to Eric Kasischke, a fire scientist at the Environmental Research Institute of Michigan, satellite remote sensing systems are the key to understanding the role of fire in the boreal forest. He says satellites can tell scientists how fire transforms the land surface as well as enable them to measure how the transformation alters the ecosystem’s biophysical processes—the mechanisms and rates at which energy and trace gases are exchanged with the atmosphere. Lou Steyaert, a remote sensing scientist for the U.S. Geological Survey, participated in BOREAS from the earliest planning stages. One of his assignments was to use multi-temporal satellite image data to help the teams decide where to go make measurements. ("Multi-temporal" means multiple data acquisitions were made over time. The BOREAS team collected satellite images over the Canadian boreal region throughout the growing seasons over four consecutive years.) "The BOREAS modelers told us what forest types they were looking for so if given a regional land cover map they would know the forest composition and distribution, hence they would know where to go make the measurements they considered important to run their models," Steyaert recalls. "Using AVHRR and Landsat images offered the quickest, most cost-effective way of surveying a million square kilometers to understand and map the boreal forest composition in the BOREAS study areas." Steyaert completed his initial analysis of the 1-km-resolution AVHRR data in 1993. As he and his colleagues reviewed the satellite images, they found the boreal forest canopy to contain a complex mosaic of landscape patches of various tree types at widely ranging stages of growth. "The first time I looked at the multi-temporal AVHRR satellite analysis over the BOREAS study areas, I had no idea what it [the patchy appearance of the canopy] meant," he said. "The importance of fire in the boreal region was well known going in. However, what had never been done before 1990 was obtaining a synoptic (large-scale) multi-spectral view from satellite remote sensors of not just recent burns, but historical burns as well." The BOREAS team didn't succeed in mapping the forest (using 1-km AVHRR data)
and validating its map until 1996. They could not be sure their satellite map
was correct until after they collected ground observations with Global
Positioning System (GPS) along several thousands of kilometers of roads, and
conducted more than five sets of low-level aircraft flights to make measurements
in remote areas. Then the team used high-resolution Landsat data to scale up
from the BOREAS study areas to the entire North American boreal region. |
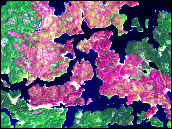
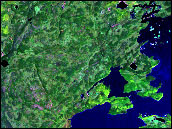
The above series of images was taken by taken by the Landsat Thematic Mapper, and is a composite of visible and near-infrared wavelengths. full image (Images courtesy Dave Knapp, NASA Goddard Space Flight Center) | ||
 The BOREAS team found that land cover across the boreal landscape was more widely-varied than previously thought. Using multi-spectral and multi-temporal remote sensing data proved to be a great way to visualize and map out the regional differences. "Our study shows the extensive heterogeneity in the land cover types as a result of natural wildfire, and the regeneration of vegetation that is a function of the date of the burn," Steyaert explained. "We then deduced that the age of the vegetation—hence biophysical characteristics—is probably a very important factor in determining the land surface fluxes of water, energy and carbon for process and modeling studies." According to Steyaert, the satellite data show that about 30 percent of the BOREAS study areas burned within the last 35 years. (After that amount of time, the newer vegetation starts to mature and blend with the surrounding land cover so it becomes more difficult to spot burned areas from satellites.) The fires were most likely started by lightning, and were typically 20-25 km in diameter within the Canadian Shield Zone. The "Shield Zone" refers to a geographic boundary above 52°N latitude where the land surface was more noticeably impacted by receding glaciers in the wake of the Earth’s last ice age (producing more small lakes and rock outcrops). In general, Canadian firefighters more aggressively monitor and fight fires south of this boundary; particularly in regions near urban populations. In multispectral AVHRR and Landsat images, you can clearly see the boundary of the Canadian Shield, north of which the landscape is obviously more varied. The BOREAS team found that at latitudes above the Shield, the forest is about 80 percent coniferous and 20 percent deciduous; below the Shield the reverse is true—20 percent coniferous and 80 percent deciduous. Moreover, above the Shield, more fires are simply allowed to run their course, therefore there are more recent burn scars that span larger areas, so there is much more new vegetation growth. "All these extensive new growth patches from old fires in the northern side of the shield are probably a good sink for carbon," Steyaert surmised. But what about south of the Shield—is it a sink or source of carbon in the presence of fire? And, perhaps more importantly, what about the Eurasian boreal ecosystem? Roughly two-thirds of the world’s boreal forest spans from Europe to Siberia, where fire fighting is known to be a much bigger problem. Historically, the data regarding the total area burned in the Russian boreal ecosystem are very poor. |
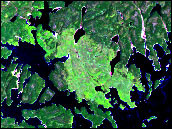
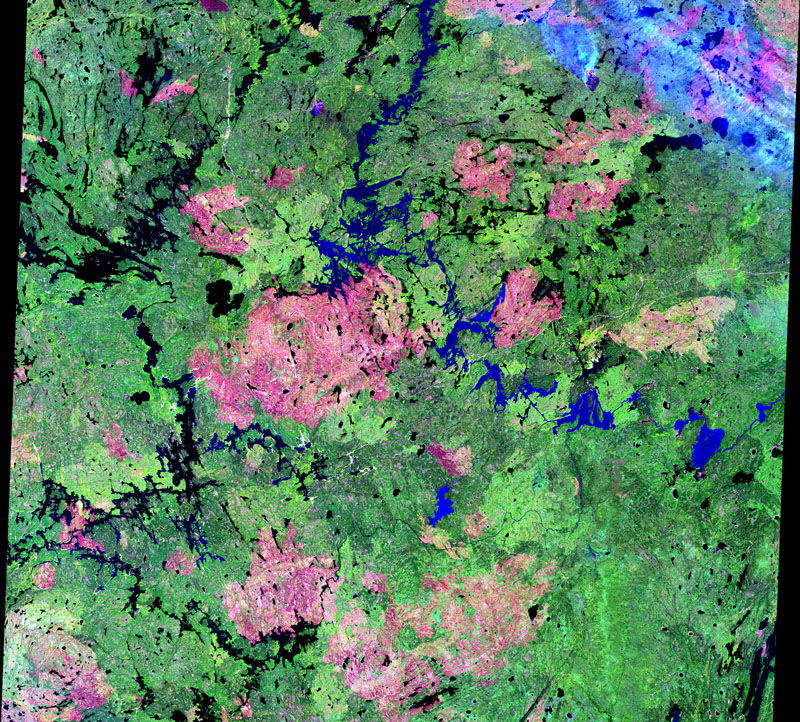
 This map—derived from NOAA Advanced Very High Resolution Radiometer (AVHRR) data from one year—shows the distribution of different landcover types in the Canadian boreal forest. The redish areas show how widespread fire is in this ecosystem. This image shows clearly the Canadian Shield boundary passing from upper left toward the lower righthand corner of this image. Notice that above the Shield there are more recent burn scars over larger regions of the forest.full image (Image courtesy Lou Steyaert, NASA Goddard Space Flight Center) |
