The Earth Observatory has published its last Image of the Day on this website. Please join us on our new home at science.nasa.gov/earth/earth-observatory.
When viewed from space, a number of patterns emerge from Earth’s aerosols—some driven by nature and others by man.
Nature generates broad swaths of particles—detectable by satellites—over both water and land. The strong winds of the “roaring forties” latitudes, for example, create a heavy band of airborne salt north of Antarctica. A thinner and more evenly dispersed veil of aerosols—primarily salt from whitecaps and sulfates from microalgae—usually covers most of the world’s oceans. Over land, massive plumes of dust blow above deserts.
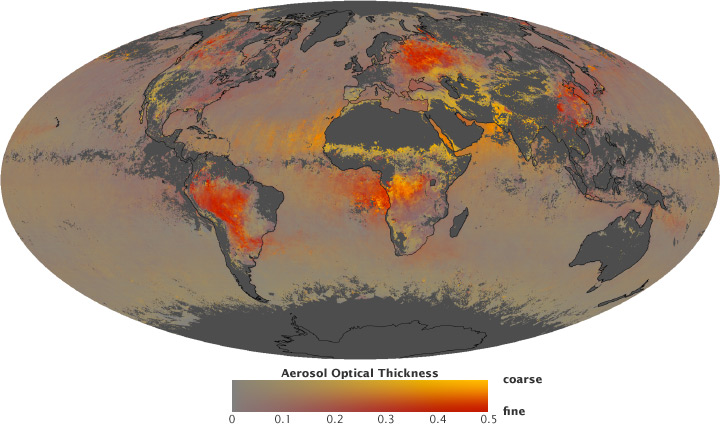
This map shows the global distribution of aerosols and the proportion of those aerosols that are large or small. Intense colors indicate a thick layer of aerosols. Yellow areas are predominantly coarse particles, like dust, and red areas are mainly fine aerosols, like smoke or pollution. Gray indicates areas with no data. (NASA map by Robert Simmon, based on MODIS data from NASA Earth Observations.)
Meanwhile, the eastern portion of the United States and urban areas in Europe are hotspots for the production of human-made aerosols. Plumes of industrial aerosols — typically sulfates from coal power plants and black and organic carbon from vehicle traffic — rise from cities such as New York, Pittsburgh, London, and Berlin.
The western portion of the United States is comparatively clear, though some areas experience aerosol loads that rival the worst conditions in the East. Industrial aerosols, dust, and wildfire smoke frequently pollute the air in the Los Angeles Basin. Agriculture can produce heavy loads of soil dust, especially in California’s San Joaquin and Imperial valleys, and the largest localized source of dust in the western U.S. is Owens Dry Lake, a river bed that was drained to provide water for LA. Likewise, the port of Houston has some of the most aerosol-laden air in the world.
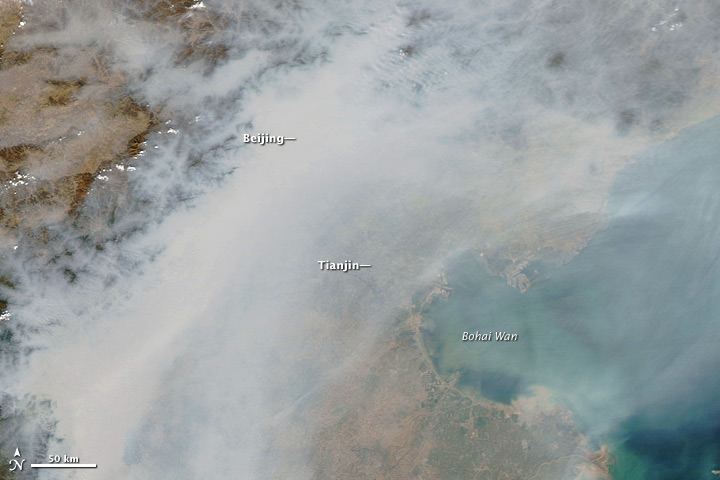
Beijing was completely obscured by air pollution on October 9, 2010. This natural-color image was acquired by MODIS aboard the Aqua satellite. (NASA image by Jeff Schmaltz, MODIS Rapid Response.)
However, the most aerosol-laden air in the United States today pales in comparison to Asia. Satellites can detect a visible pall of aerosol clouds over Bangladesh, northern India, and northern Pakistan—an area called the Indo-Gangetic plain, especially during the pre-Monsoon season. The aerosol layer is comprised of complex mixtures of dust blowing from the Thar Desert and pollution from the densely populated plain. In eastern China, fast-growing cities such as Beijing also produce heavy blankets of aerosol.
Depending on the season and weather conditions, surges of aerosols can make their way into the atmosphere almost anywhere on Earth. In the Northern Hemisphere, plumes of mineral dust swirl over deserts and arid regions. In the Southern Hemisphere, slash-and-burn agriculture in the Amazon and Central Africa releases large amounts of smoke and soot. Fires, some sparked by lightning and some by human activity, leave large patches of forest ablaze during summers in Canada, Russia, and the United States.
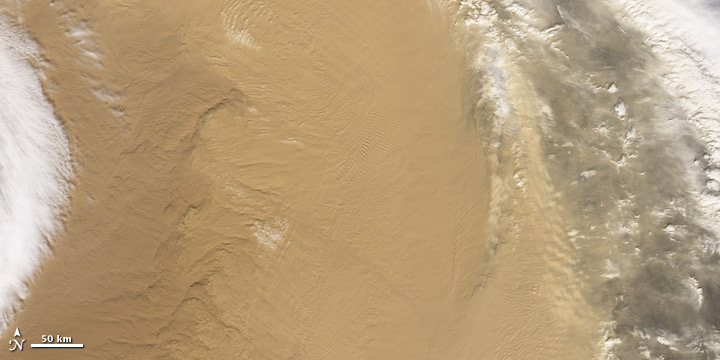
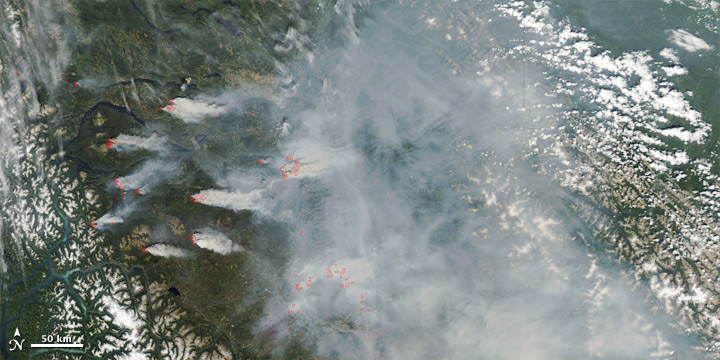
Dust storms (top) and wildfires (bottom) are significant, if transient, sources of aerosols. (NASA images by Jeff Schmaltz, MODIS Rapid Response.)
Although most aerosols remain suspended in the atmosphere for short periods—typically between four days and a week—they can travel vast distances. Particles moving with the atmosphere at 5 meters (16.4 feet) per second will travel thousands of kilometers in a week. Dust plumes from the Sahara frequently cross the Atlantic and reach the Caribbean. Winds sweep a mixture of Asian aerosols—particularly dust from the Gobi desert and pollution from China—east over Japan and toward the central Pacific Ocean. Smoke from wildfires in Siberia and Canada can find its way to the Arctic ice cap.
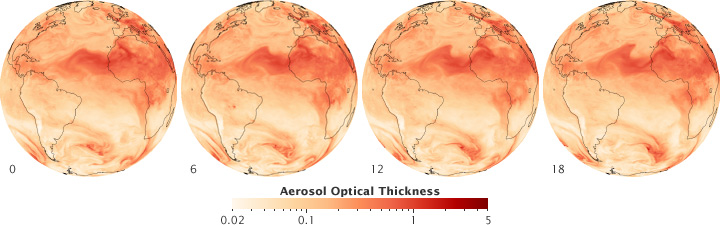
Dust from North Africa spreads over the Atlantic Ocean on July 1, 2009 (from 00:00 to 18:00 Universal Time) in this series of images derived from a computer model of aerosol movement. Click for animation. (NASA maps by Pete Colarco and Robert Simmon, based on GEOS-5 model data.)
Over time, aerosol emissions have changed significantly. In Asia, anthropogenic emissions have increased in recent decades as urbanization and industrialization has proceeded at a breakneck pace. By contrast, aerosols have declined in North America and Europe as factories have moved to developing countries and Western nations have adopted more stringent clean air regulations.
