In October 2021, natural-color images from the Landsat and Terra satellites returned striking views of record-breaking backlogs of container ships idling offshore of some of America’s largest ports. Surging demand for consumer goods, labor and equipment shortages, and an array of COVID-related supply chain snarls have contributed to the backlogs.
Now atmospheric scientists are working with air pollution data collected by satellites to find out whether the unusual shipping activity is affecting air quality near ports. Though other industries and processes may be playing a role, a preliminary look at satellite observations of nitrogen dioxide pollution offshore of ports suggests that shipping may be contributing to an uptick in pollution.
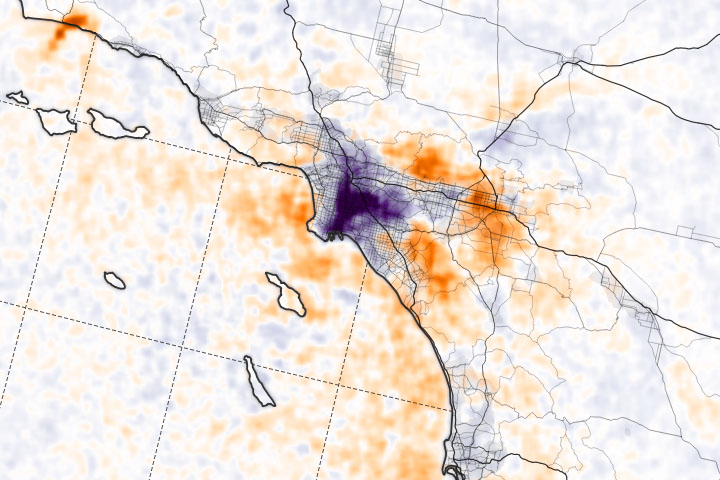
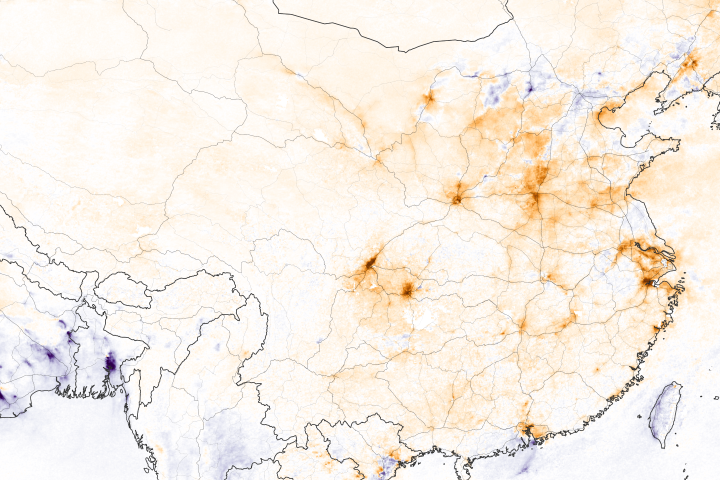
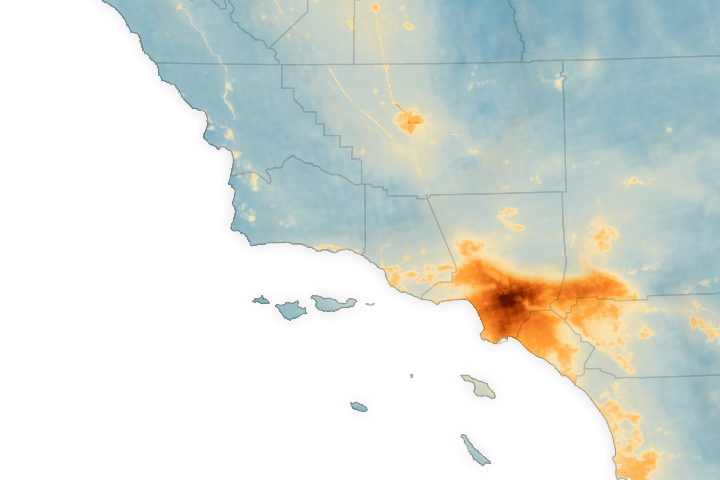
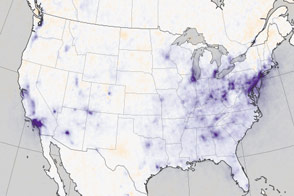
The maps above and below show the concentration of the air pollutant nitrogen dioxide (NO2) between October 1-23, 2021, as compared to the same period in 2019 and 2018 (before the COVID-19 pandemic upended global trade). The ports of Los Angeles, Long Beach, New York/New Jersey—the busiest ports in the United States—show apparent increases in NO2 in October 2021.
These data were collected by the Tropospheric Monitoring Instrument (TROPOMI) on the European Commission’s Copernicus Sentinel-5P satellite, built by the European Space Agency. The predecessor to TROPOMI, the Ozone Monitoring Instrument (OMI) on NASA’s Aura satellite, makes similar measurements. (Note: a recent algorithm change can artificially elevate more recent TROPOMI observations of NO2 by 10 to 15 percent. The maps on this page have corrected for this.)
The elevated concentrations of NO2 near the ports appear to be at least partly a consequence of having dozens of ships waiting several days to unload their cargo. On October 21, there were 105 ships waiting for a berth at the Los Angeles and Long Beach ports, according to data from the Marine Exchange of Southern California. While ship backups are not as severe off of New York/New Jersey, those port facilities have also seen some backlogs and unusually high cargo movement in recent months.
Since there is only enough room for roughly 60 cargo ships to drop anchor in shallow waters near the Los Angeles and Long Beach ports, the rest of the waiting ships are held in deeper waters, where they keep their main engines running and move in circles to maintain their position. Even ships that are anchored still need to run auxiliary engines to keep key systems operational. On multiple occasions in October 2021, anchored ships had to activate their main engines or move to deeper water to ride out inclement weather. All of these scenarios generate emissions of nitrogen dioxide, sulfur dioxide, fine particulate matter (PM2.5), and other pollutants that can lead to more smog and ozone downwind in more populated areas.
In addition to the large numbers of waiting ships, another factor that may be contributing to higher pollution levels is that all three ports are processing significantly more goods than in previous years due to surging consumer demand. The Los Angeles and Long Beach ports have seen roughly 50 percent increases in the movement in cargo in some months in 2021 compared to 2019, according to a report from the California Air Resources Board. Likewise, the port of New York/New Jersey reports record-breaking cargo volumes in 2021.
The satellite observations of nitrogen dioxide also hint at other processes happening onshore. The small area of elevated NO2 near Santa Barbara is related to the smoke plume from the Alisal fire, which burned through chaparral along the California coast in mid-October. Meanwhile, the blue area immediately over Los Angeles points toward reductions in urban emissions over the city core.
“Part of what we may be seeing over Los Angeles is that the controls on mobile (trucks, cars, trains) and stationary (factories) sources of NO2 that have come into effect in recent years have been effective, especially some of the controls at the port itself,” said Ted Russell, a Georgia Tech atmospheric scientist and member of a NASA Applied Sciences team focused on air quality. Since 2006, the LA and Long Beach ports have enacted a clean air plan that has led to significant reductions in NO2 emissions.
Other researchers note the COVID-related changes in transportation habits may be a factor. “The blue spot over downtown Los Angeles may be the result of fewer people commuting into offices downtown and working remotely instead,” said Daniel Goldberg, an atmospheric scientist at George Washington University. “When you are looking at satellite data showing changing concentrations of pollution, you always have to keep in mind that there are multiple factors at play that can be hard to disentangle.”
Goldberg, Russell, and other atmospheric scientists all caution that other factors—especially wind and weather conditions—can make it quite challenging to interpret changes in nitrogen dioxide. “Double the wind velocity, and you can approximately halve the concentrations. Change the wind direction, and one area appears to have more, another less,” said Russell. One recent analysis by Goldberg found that strong winds or the direction of the winds could change NO2 concentrations over Los Angeles by as much as 80 percent.
In this case, it is possible that days with strong Santa Ana winds in 2018-19 could have exaggerated the apparent increase in NO2 over Riverside and Irvine. “Without taking a careful look at the meteorology, what I can say is that this preliminary data certainly supports the idea that we’re seeing increased emissions offshore due to the shipping backlogs,” said Russell. “In another month or two, it might be possible to tell a much clearer story.”
NASA Earth Observatory images by Joshua Stevens, using modified Copernicus Sentinel 5P data processed by the European Space Agency. Story by Adam Voiland, with fact-checking and interpretation from Daniel Goldberg (George Washington University), Ted Russell (Georgia Tech), and Aristeidis Georgoulias (Aristotle University of Thessaloniki).
alert message