The blue whale—the largest animal on Earth—measures on average 27 meters (89 feet) long. But its impressive size does not mean the species is safe in the sea. A national database for marine mammal health reported that collisions with ships killed 10 of the 12 blue whales found dead along the California coast between 2007-2017. Not included in that count were whales that were struck and sunk, injured in a collision, or tangled in fishing gear.
In 2015, scientists presented a new online tool called WhaleWatch aimed at preventing potentially deadly encounters between whales and ships. Partly funded by the NASA Applied Sciences Program and produced by a team of scientists at the University of Maryland Center for Environmental Science, Oregon State University, and the National Oceanic and Atmospheric Administration (NOAA), the program uses satellite data on environmental conditions to make monthly estimates of where whales are most likely to be located along the Pacific coast of the United States and Canada. WhaleWatch data are now regularly updated and available from NOAA.
Elliott Hazen, a NOAA researcher who led the development of the model, likens the tool to the apps that help auto drivers avoid traffic during their commute. “If a certain road has high traffic, you’ll likely have to slow down and you may want to explore another route,” Hazen said. “We hope that the WhaleWatch product can work in exactly the same way.”
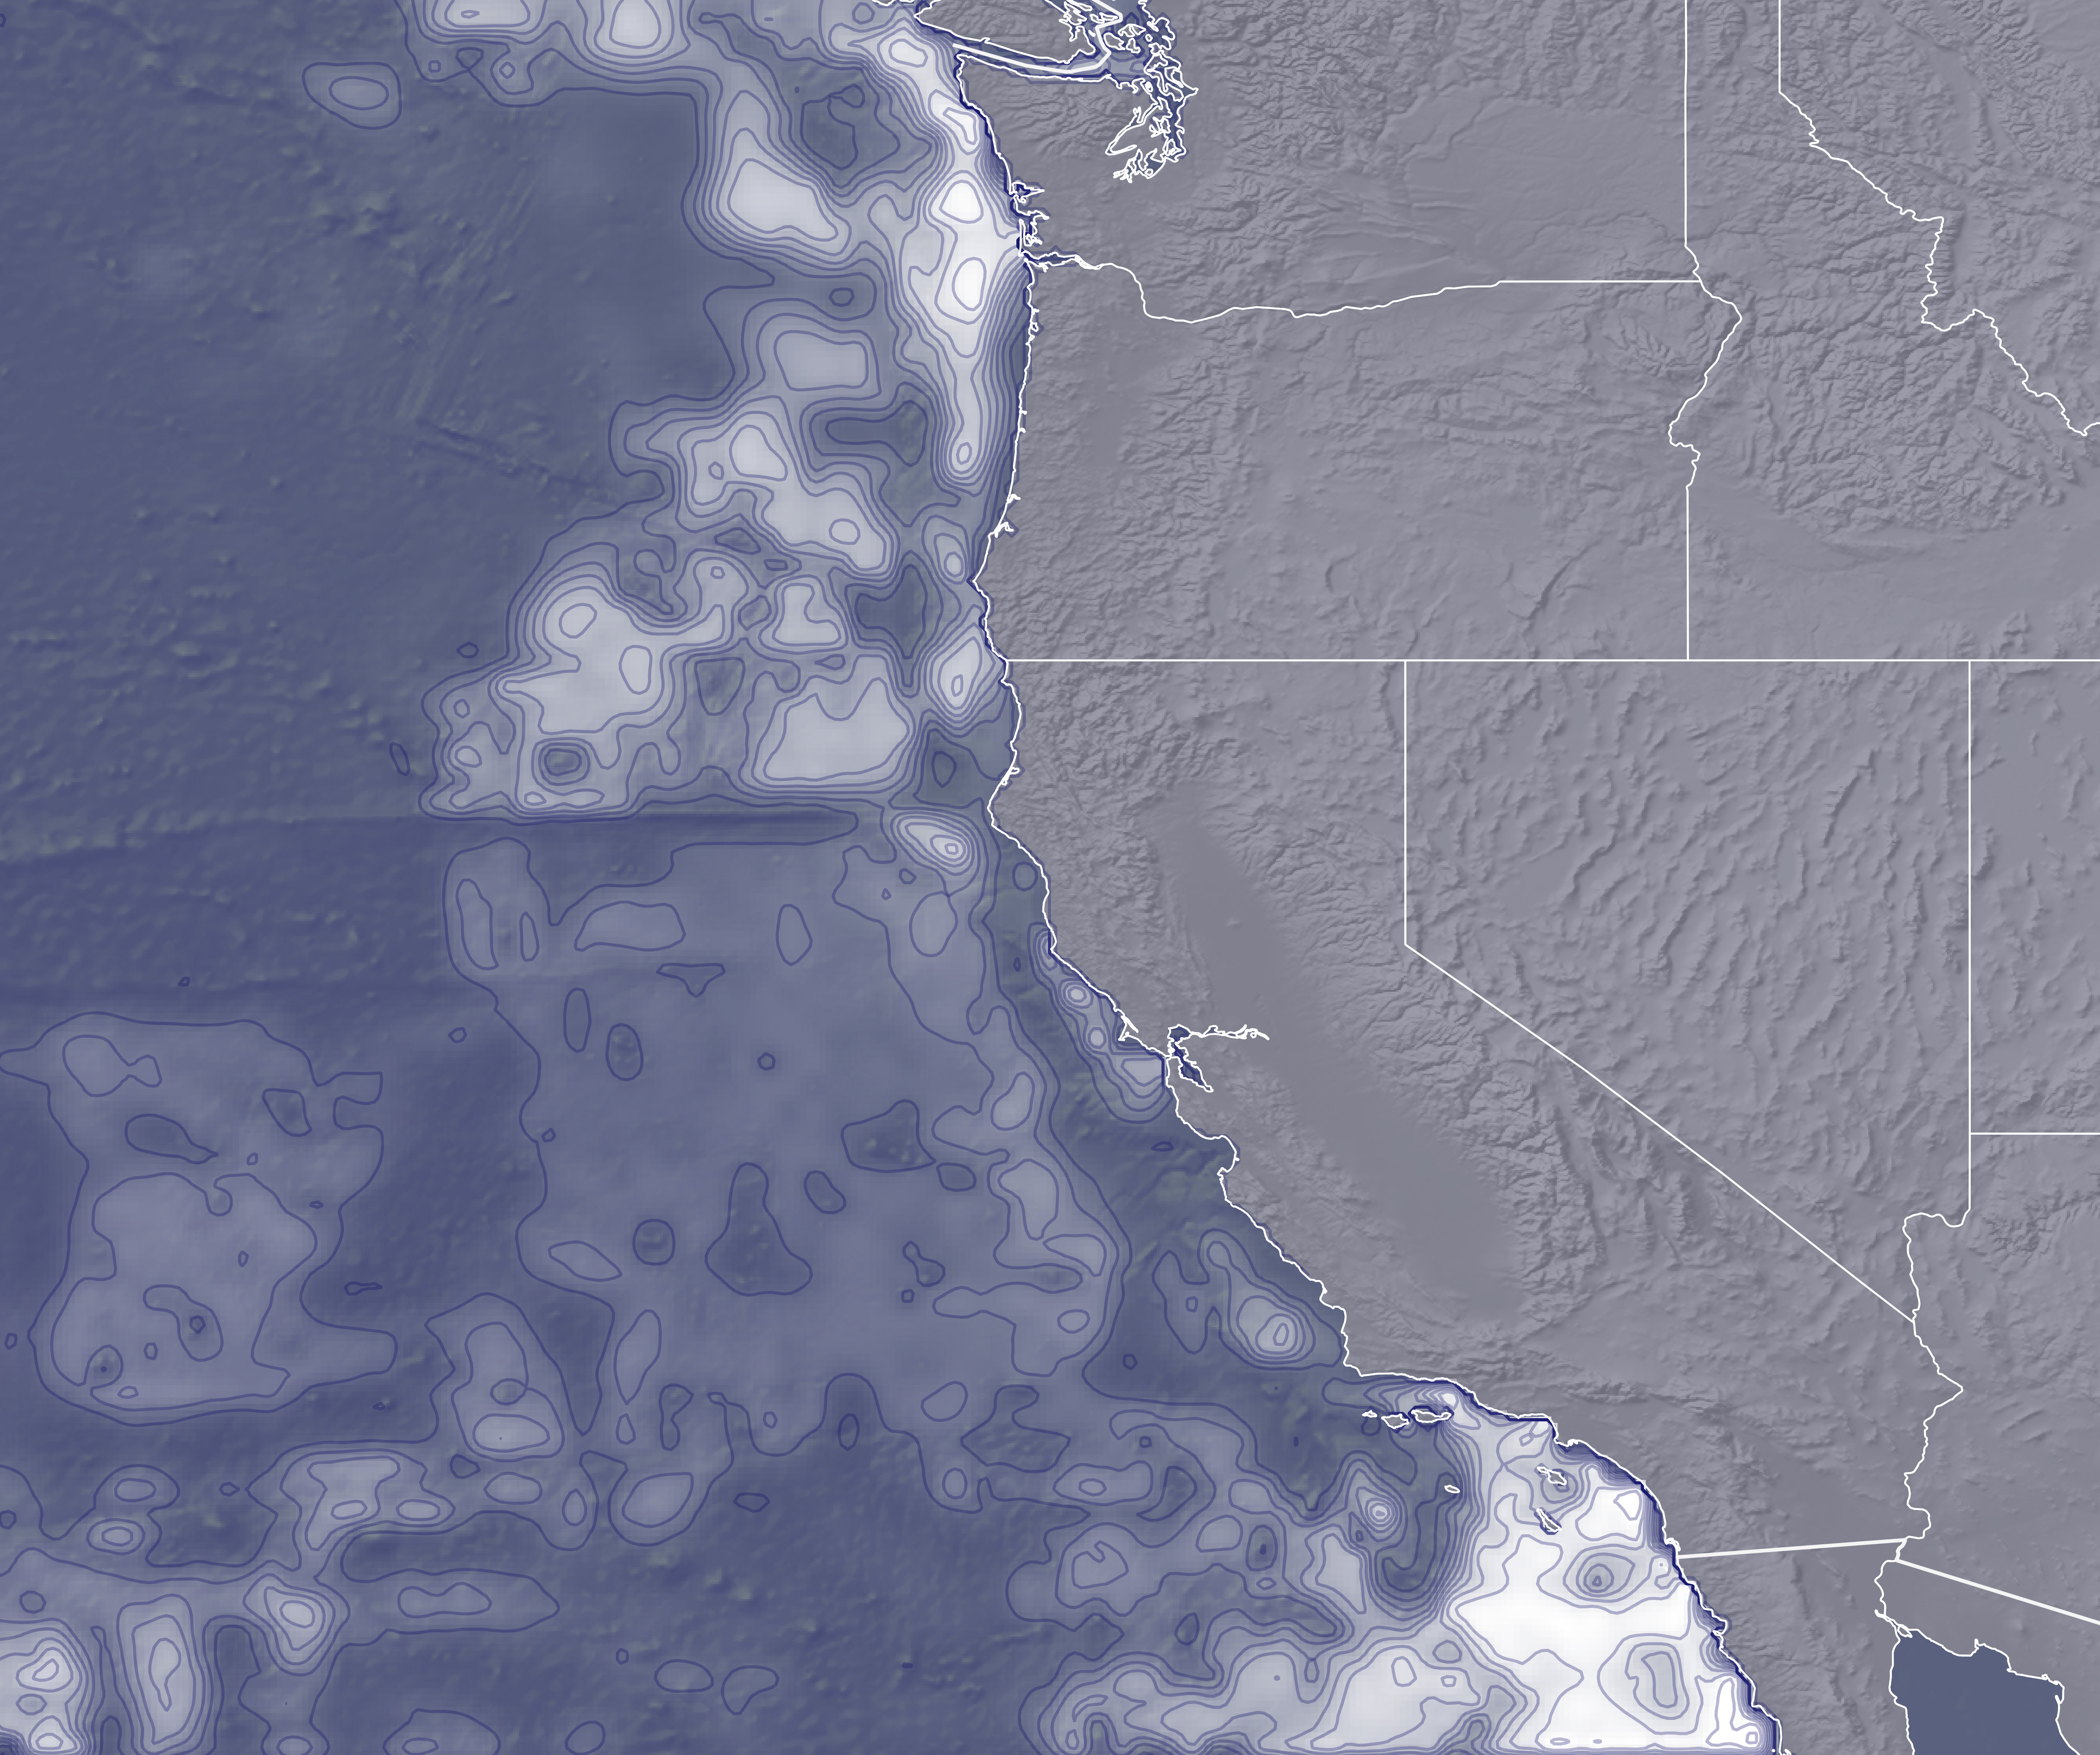
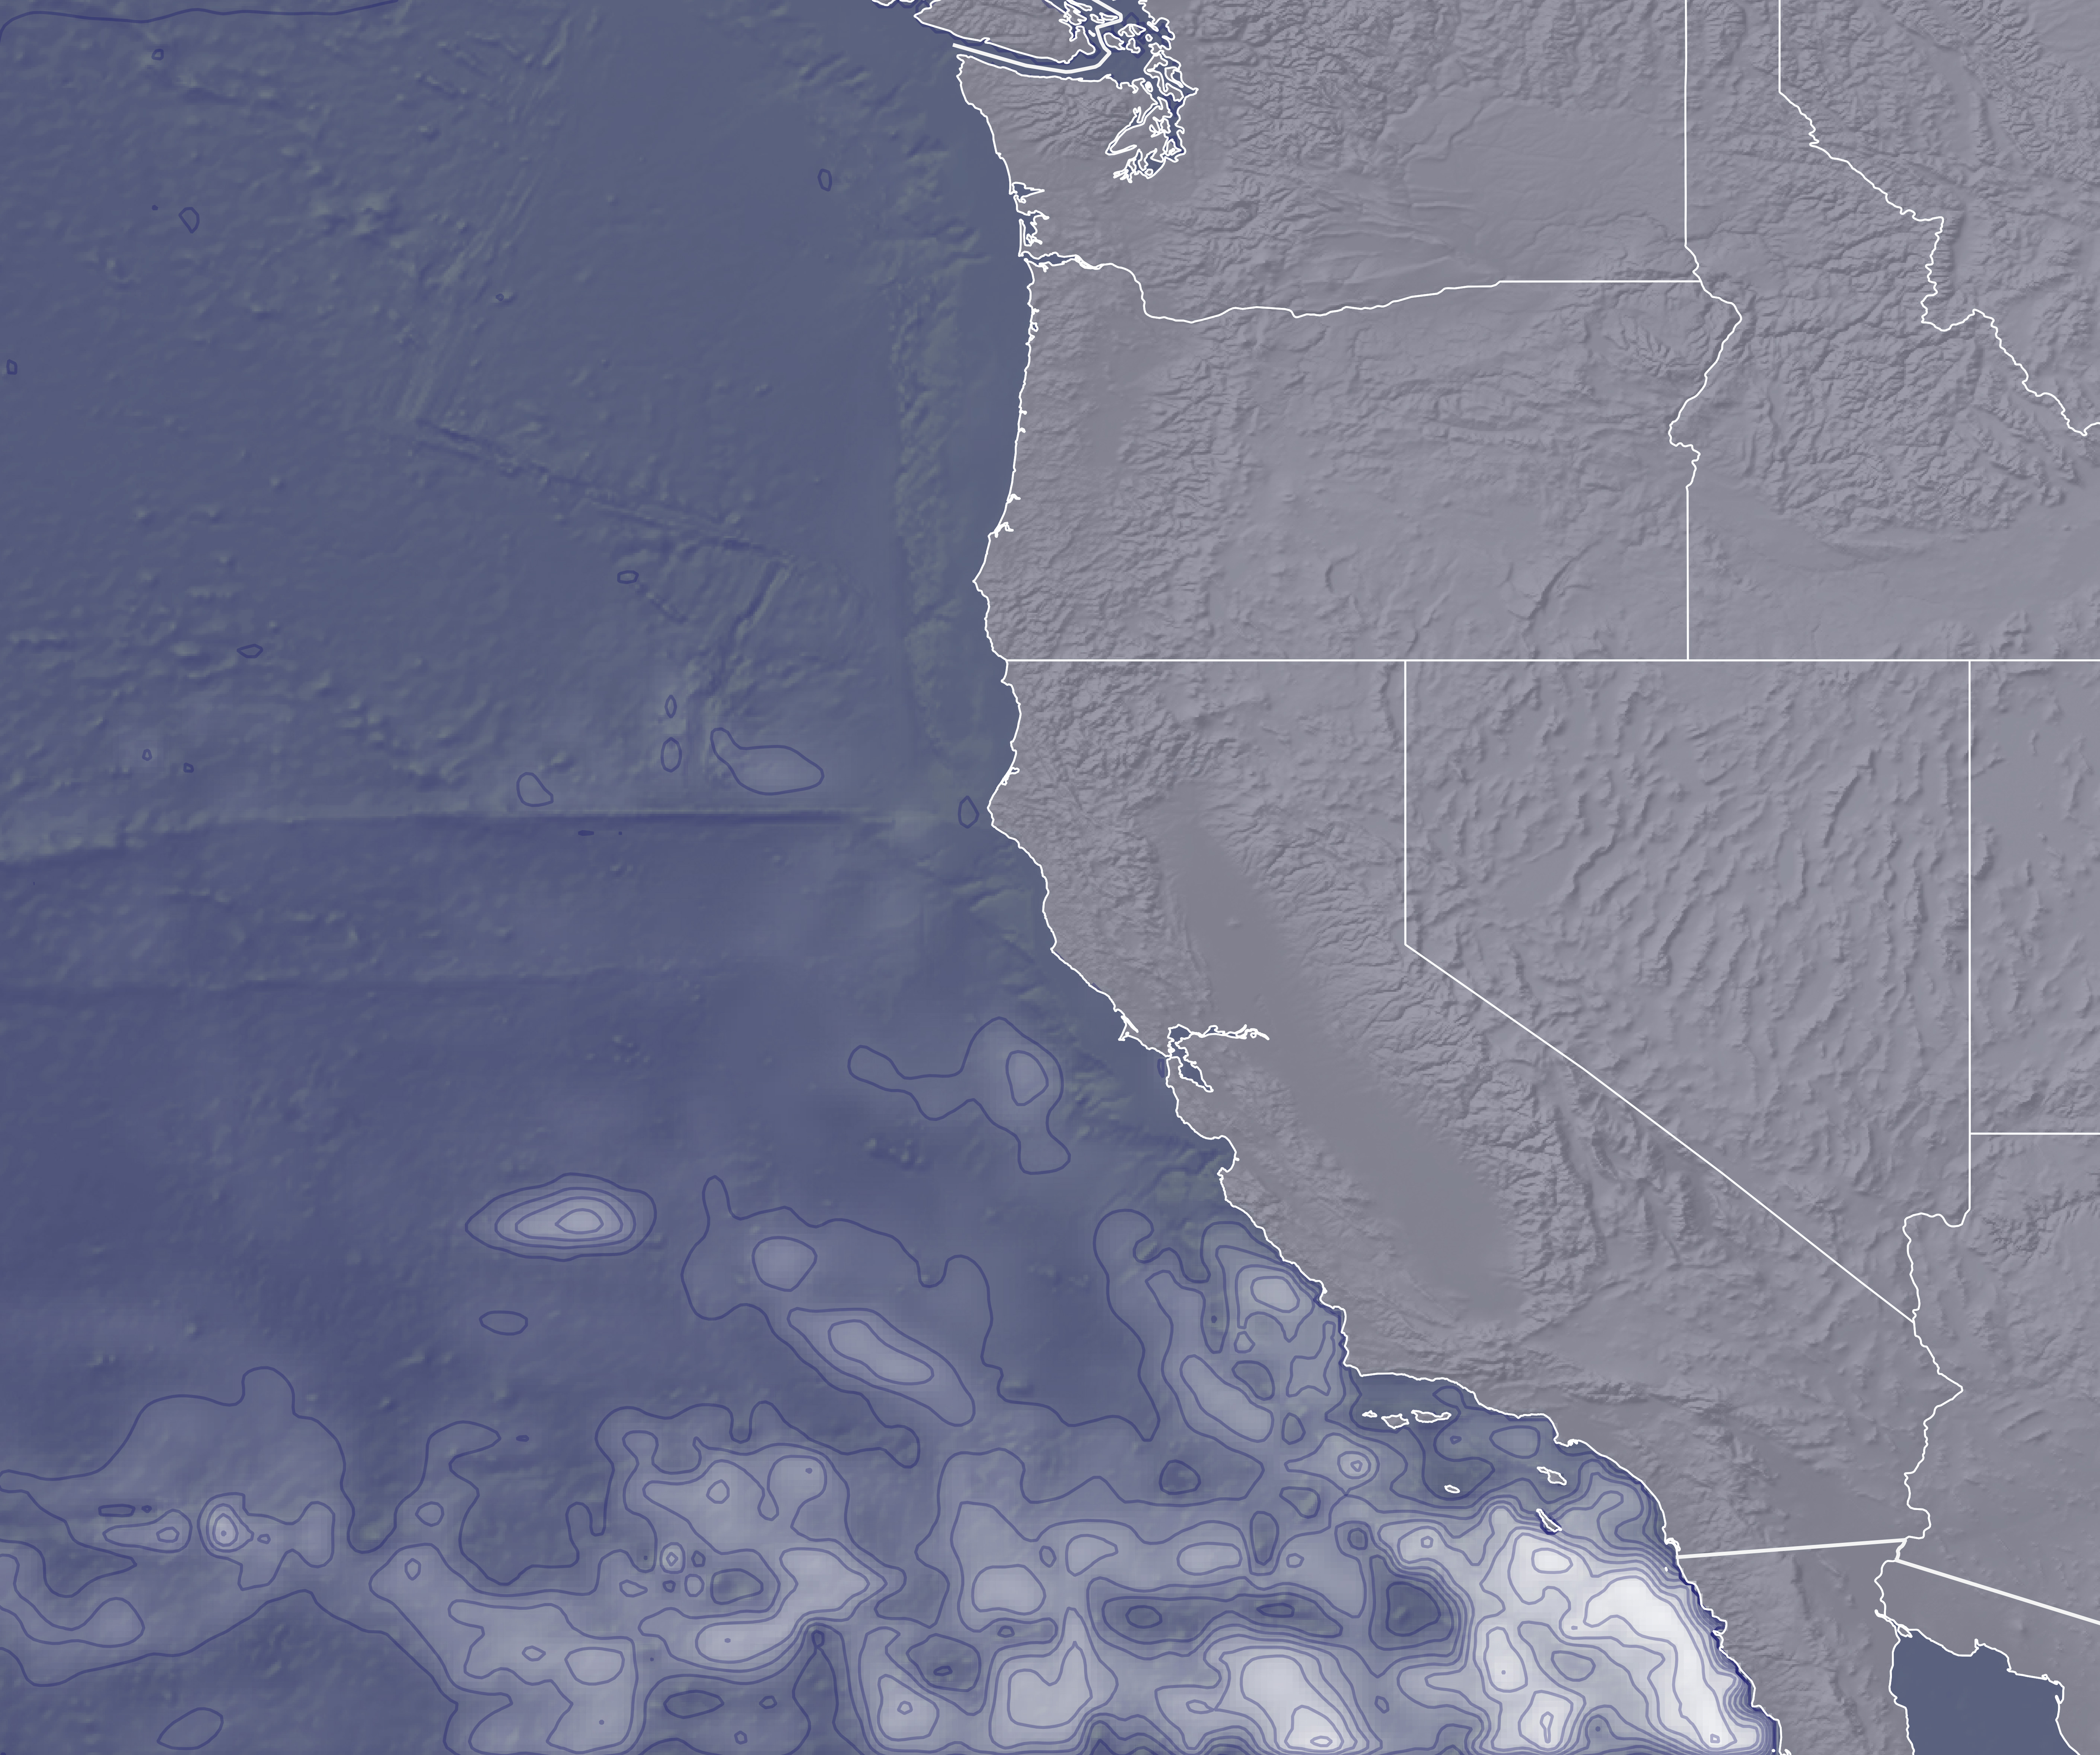
The map above shows a whale likelihood estimate for September 2018. Light-colored areas had a higher chance of an encounter. The map is derived from a wide range of environmental variables detected by satellites from NASA and other agencies. Two of these variables—cooler waters and an intermediate amount of the pigment known as chlorophyll-a—are the main factors that bring more whales.
“This is likely due to an ecological lag where high chlorophyll brings in higher amounts of krill, that then attract the feeding whales,” Hazen said.
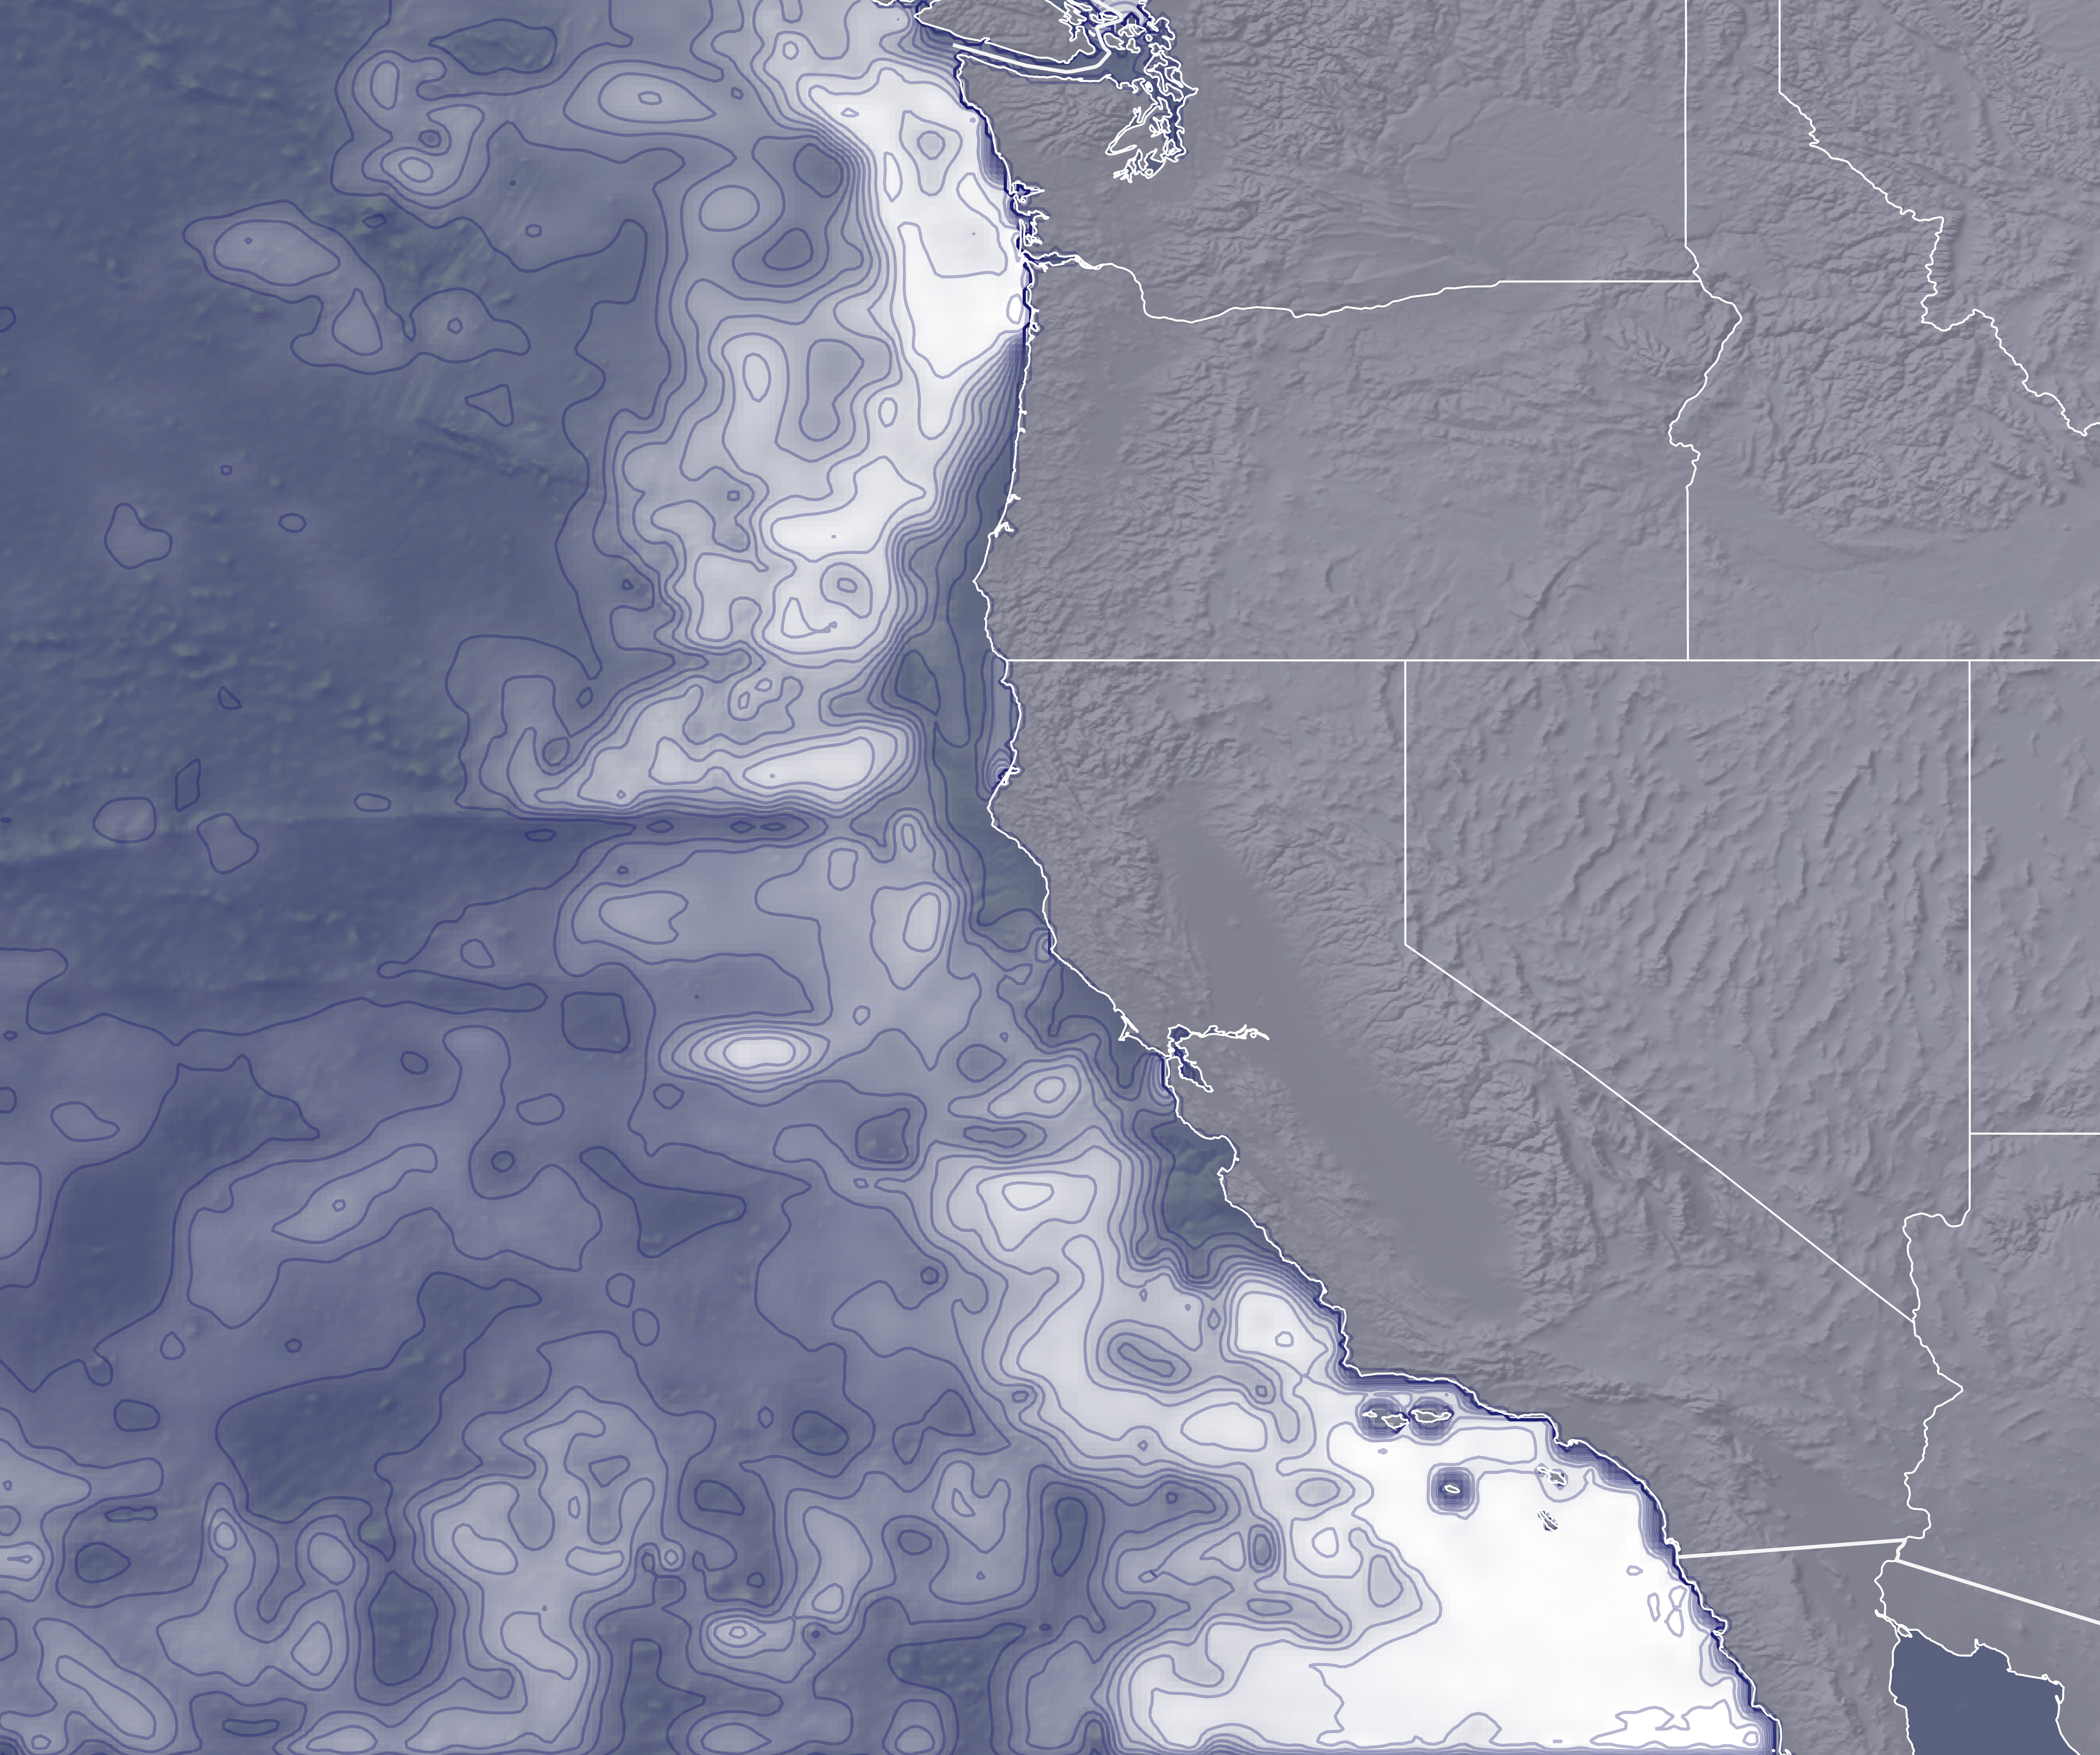
Factors attracting whale location vary over time, and WhaleWatch can tell you how. The maps above show extreme ends of the spectrum, when the likely presence of whales in 2018 was comparatively low (February) and high (July).
WhaleWatch data like these are delivered directly to NOAA’s West Coast Region office, which manages the whale population in the California Current. Management for ship strike risk in California is currently voluntary, but according to Hazen: “The Channel Islands National Marine Sanctuary and organizations like the Benioff Ocean Initiative are doing a lot of work to explore ways that tools like this can be helpful in reducing ship strike risk.”
NASA Earth Observatory maps by Lauren Dauphin using whale likelihood data from WhaleWatch. Story by Kathryn Hansen.
alert message


