

 |
|||
|
During the afternoon of November 3, 2002, the water in Seattle’s Lake Union suddenly began sloshing hard enough to knock houseboats off their moorings. Water in pools, ponds, and bayous as far away as Texas and Louisiana splashed for nearly half an hour. The cause? Alaska’s Denali Fault was on the move, jostling the state with a magnitude 7.9 earthquake. The earthquake began at 1:12 p.m. Alaska local time, and was centered approximately 135 kilometers (84 miles) south of Fairbanks and 283 kilometers (176 miles) north of Anchorage. Shaking at the epicenter lasted approximately 1.5 to 2 minutes, but in Fairbanks the duration of the earthquake was over 3 minutes.
Originating on the previously unknown Susitna Glacier Fault, the earthquake shot eastward along the well-known Denali Fault at a speed of over 11,265 kilometers (7,000 miles) per hour before branching southeast onto the Totschunda Fault. The resulting surface rupture was approximately 336 kilometers (209 miles) long, and it cut through streams, divided forests, opened chasms in roads, and even generated fault traces visible across several glaciers. Because the earthquake released most of its energy on the sparsely populated eastern end of the fault, Alaska’s major cities were spared serious damage.
|
November 13, 2003
Photo in title graphic courtesy of the USGS For more information, visit the Alaska Satellite Facility DAAC. (A new browser window will open.) 
|
||
 |
|||
|
The November 3 Denali Fault earthquake was preceded by the magnitude 6.7 Nenana Mountain earthquake on October 23. Now considered a foreshock of the larger quake, the October earthquake caused no surface ruptures. Both quakes were centered along the Denali Fault. Andrew Ford, a researcher at the University of Utah, was studying the fault system in southeast Alaska with colleagues Rick Forster and Ron Bruhn, both professors at the University of Utah. “When the earthquakes occurred, we wanted to see if we could determine how much ground motion there was,” said Ford.
Using a remote sensing technique called InSAR (Interferometric Synthetic Aperture Radar), Ford created a map of surface changes caused by the earthquake. Interferometry involves taking Synthetic Aperture Radar (SAR) satellite images from two different dates and precisely calculating the differences between the two. The resulting image, called an interferogram, shows where deformation occurred on the Earth’s surface. “Interferometry is a good way to locate faults and see which sections are susceptible to deformation,” said Evelyn Price, a research associate at the University of Texas Institute for Geophysics.
|
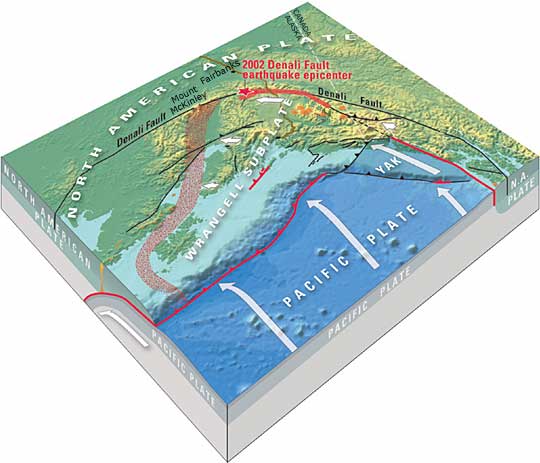
The map above shows the tectonic plates that influence Alaska’s southeastern fault systems. The Pacific Plate is actively subducting (sliding under) the North American Plate at a rate of about 2 inches per year. The Yakutat block (labeled YAK) prevents the Pacific Plate from subducting smoothly, causing the Wrangell Subplate to break off the North American Plate and rotate counterclockwise. The Denali and Totschunda Faults are located along the northeastern edge of the Wrangell Subplate. Image courtesy of the USGS | ||
 |
|||
|
In the past, scientists typically relied on SAR imagery from the European Remote Sensing (ERS) satellites, ERS-1 and ERS-2, to map earthquake deformation. But ERS-1 failed in 2000, and ERS-2 began malfunctioning shortly afterwards. So Ford and his colleagues turned to SAR imagery from RADARSAT-1 (a satellite managed by the Canadian Space Agency), which had never before been applied in earthquake interferometry. One of the biggest challenges with SAR imagery is the infrequency of satellite overpasses. In that respect, RADARSAT-1 had an advantage over the ERS missions. “RADARSAT-1 repeats its orbit every 24 days, whereas ERS-1 and ERS-2 repeated every 35 days,” said Ford. Surface changes occurring between orbits (such as excessive rainfall or snowfall, or changes in vegetation) can cause “noise” in interferograms, making them less accurate. “The less time between repeat orbits, the less chance there is for change on the Earth’s surface,” said Ford. After the November 3 earthquake, Ford and his colleagues contacted the Alaska Satellite Facility (ASF) in Fairbanks. “ASF gave us priority. Once the satellite acquired the image we needed, ASF downloaded and formatted it, and it was ready for us within hours,” said Ford. Fortunately, ASF had images from October 5 (prior to the foreshock earthquake), October 29 (between the two earthquakes), and November 22 (after the second earthquake) that included the area of both earthquakes’ epicenters.
ASF’s fortuitous collection of images allowed Ford and his colleagues to make a series of three interferograms: one for each of the earthquakes, and a cumulative interferogram that includes both earthquakes. “It’s the first time this has ever been done in earthquake research. Every pair of SAR images used in the past has straddled both the major foreshocks and the mainshock. Now we can actually separate the two quakes,” said Ford.
|
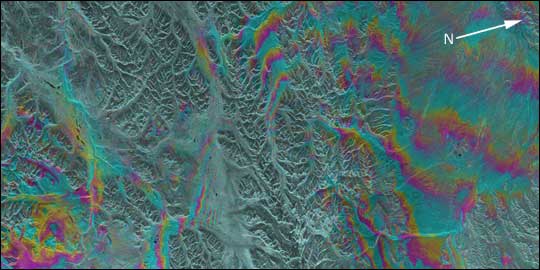
This Synthetic Aperture Radar (SAR) interferogram includes the epicenters of the October 23, 2002, and November 3, 2002 Denali Fault earthquakes, which are located at the extreme western end of the fault rupture. RADARSAT-1 images used are from October 16 and November 9, 2002, and cover 100 kilometers by 200 kilometers. Each color cycle (e.g., blue-to-blue) can be regarded as a contour showing approximately 3 centimeters of ground motion. Note how these contours appear to radiate like ripples in a pond. The points from which they radiate indicate the epicenters of the earthquakes. Image courtesy of Andrew Ford, University of Utah, SAR data originally supplied by the Alaska Satellite Facility | ||
  |
|||
|
The ability to generate interferograms for each earthquake allowed Ford to investigate how the foreshock focused tectonic stresses and added strength to the mainshock. Because earthquakes tend to recur along faults, an earthquake that relieves stress on one part of a fault may actually increase stress on other parts of a fault system. Alaska’s network of faults is a result of tectonic activity; the Pacific Plate is actively subducting (sliding under) the North American Plate, and the Denali Fault is located on the boundary between the two plates. Prior to the 2002 earthquakes, the Denali Fault was known to be seismically active, but scientists weren’t sure if it was capable of generating a large earthquake. Because some of the faults in southeast Alaska are heavily glaciated, Ford and his colleagues are also interested in studying the relationship between glaciers and structural geology. Glaciers tend to flow down fault lines, eroding the ground surface and acting as conveyor belts for rock material. They also prevent material from filling in faults, which tends to keep faults active.
In addition, landslides completely covered parts of several Alaskan glaciers after the November 3 Denali Fault earthquake. Landslide material may insulate glacier ice, raising its temperature towards the melting point. The additional weight of rocks and dirt can also cause greater pressure and melting at the base of the glacier, increasing the likelihood that a glacier may surge forward. “We want to know how earthquakes affect the behavior of these glaciers and how the glaciers are moving and responding,” said Ford.
|
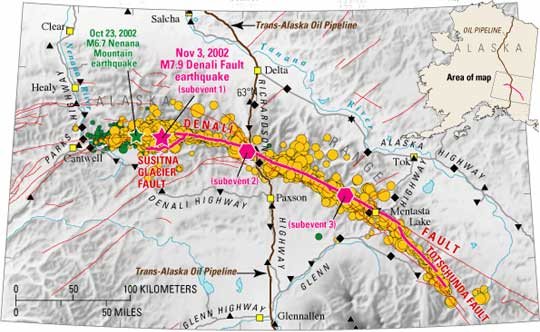
This map of Susitna Glacier and the Totschunda Faults shows the locations of the October 23, 2002 and November 3, 2002 earthquakes and their aftershocks. Image courtesy of the USGS | ||
|
Even though the earthquakes occurred in a sparsely populated area, scientists are keeping an eye on the Denali Fault because of its similarities to the San Andreas Fault, located near heavily populated areas in California. According to Ford, “The Denali Fault earthquake was the ‘big one’ for Alaska.” The cracks in the Earth’s surface along parts of the fault were up to 6.7 meters (22 feet) wide, which would have caused considerable damage to a more heavily populated area, such as California. While the November 3 earthquake in Alaska caused few injuries and no deaths, it did cause numerous landslides and damaged roads and bridges at a cost of at least $25 million. In addition, both of the Denali Fault earthquakes occurred at a depth in the Earth’s crust of 5 kilometers (3.1 miles) or less, which is considered relatively shallow. “Usually, the earthquakes that are damaging to populations and structures occur close to the surface, so this is significant,” said Price. By further studying and understanding the kind of deformation that split open the ground surface in Alaska, scientists hope to glean clues about earthquake damage potential along the San Andreas Fault. The InSAR maps of surface deformation near the earthquake epicenters that Ford and his colleagues generated agreed with USGS findings, which included aerial and ground surveys of the fault rupture, as well as Global Positioning System (GPS) measurements. Although Alaska’s Denali Fault was home to a network of GPS receivers, earthquakes are unpredictable, and no one knows whether the next one will strike in a location with a GPS receiver to measure it. “With InSAR, we can capture the whole picture, no matter where the epicenter of an earthquake is,” said Ford. “And you can’t measure ground motion on the scale of millimeters over that kind of area unless you use interferometry.” Evelyn J. Price and David T. Sandwell. 1998. Small-scale deformations associated with the 1992 Landers, California, earthquake mapped by synthetic aperture radar interferometry phase gradients. Journal of Geophysical Research. 103(B11):27,001-27,016. USGS Fact Sheet 014-03: Rupture in South-Central Alaska — The Denali Fault Earthquake of 2002. Accessed August 10, 2003. M7.9 Earthquake on November 3, 2002. Accessed June 26, 2003. InSAR concepts. Accessed July 23, 2003. |
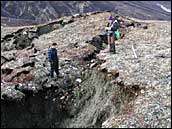 A fault scarp is visible near Augustana Creek, Alaska. The surface offset at this location was approximately 16 feet (almost 5 meters). Image courtesy of the USGS A fault scarp is visible near Augustana Creek, Alaska. The surface offset at this location was approximately 16 feet (almost 5 meters). Image courtesy of the USGS
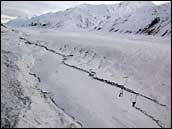 A trace of the Denali Fault runs up the north side of the Canwell Glacier. Image courtesy of the USGS A trace of the Denali Fault runs up the north side of the Canwell Glacier. Image courtesy of the USGS |
||