A History of Scatterometry The first scatterometer flew as part of the Skylab missions in 1973 and 1974, demonstrating that spaceborne scatterometers were indeed feasible. Then, from June to October 1978, the Seasat-A Satellite Scatterometer (SASS) proved that accurate wind velocity measurements could be made from space. In the 1990s, a single-swath (-beam) scatterometer was one of the instruments to fly on the European Space Agency's ERS-1 (currently in stand-by mode) and ERS-2 Remote Sensing Satellites, launched in July 1991 and April 1995 respectively. The NASA Scatterometer (NSCAT) which launched aboard Japan's ADEOS-Midori Satellite in August, 1996, was the first dual-swath, Ku-band scatterometer to fly since Seasat. From September 1996, when the instrument was first turned on, until premature termination of the mission due to satellite power loss in June 1997, NSCAT performed flawlessly and returned a continuous stream of global sea surface wind vector measurements. Unprecedented for coverage, resolution, and accuracy in the determination of ocean wind speed and direction, NSCAT data has already been applied to a wide variety of scientific and operational problems. These applications include such diverse areas as weather forecasting and the estimation of tropical rain forest reduction. Because of the success of the short-lived NSCAT mission, future Ku-band scatterometer instruments are now greatly anticipated by the ocean winds user community.
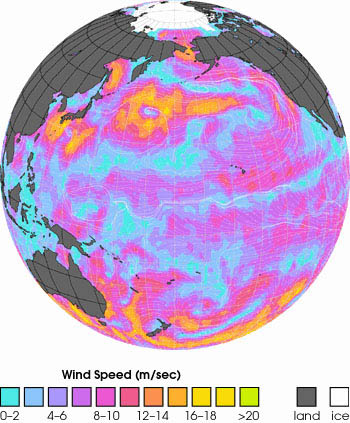
This image shows ocean surface wind speeds and directions over the Pacific Ocean on September 21, 1996 as they were measured by the NASA Scatterometer (NSCAT) which was onboard Japan's Advanced Earth Observing Satellite (ADEOS). The background color indicates wind speed and the white arrows show the direction of the wind. The strong Trade Winds (red) blow steadily from the cooler subtropical ocean to the warm water of the Intertropical Convergence Zone (ITCZ) located just north the Equator. Instead of blowing in the north-south direction, the winds are deflected westward by the Coriolis effect, an apparent force arising from the rotation of the Earth on its axis. The air rises over the warm water of ITCZ and sinks in the subtropics at the Horse Latitudes, forming the Hadley Circulation. Both the convergence area at the ITCZ and the divergence area at the Horse Latitudes are indicated by low wind speed of blue color. In the sub-tropics and mid-latitudes, hurricanes (typhoons) rely on some contribution from the Coriolis effect in order to develop their characteristic spin (yellow spirals). Two typhoons are observed in the western Pacific. Typhoon Violet is just south of Japan. After these data were taken, Typhoon Violet struck the East Coast of Japan causing damage and deaths. Typhoon Tom is located further east and did not make landfall. Courtesy of NASA JPL. next: Why
is Scatterometry Important? |

Scatterometry |
alert message