The night is nowhere near as dark as most of us think. In fact, the Earth is never really dark. And we don’t have to be in the dark about what is happening at night anymore either. —Steven Miller, atmospheric scientist, Colorado State University
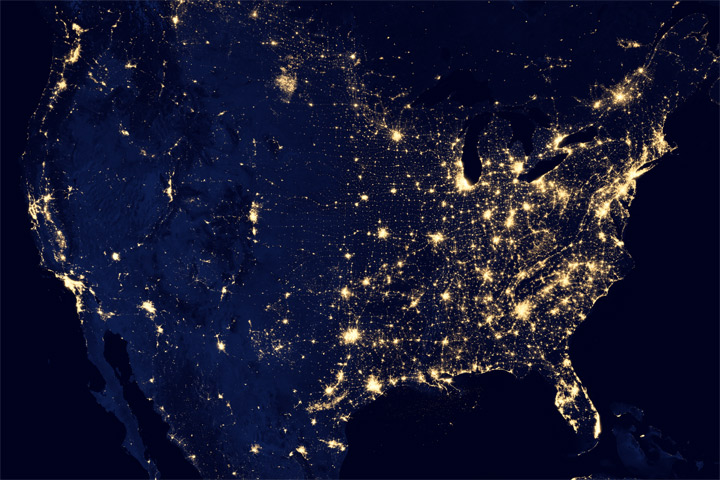
The night side of Earth twinkles with light. The first thing to stand out is the cities. “Nothing tells us more about the spread of humans across the Earth than city lights,” asserts Chris Elvidge, a NOAA scientist who has studied them for 20 years.
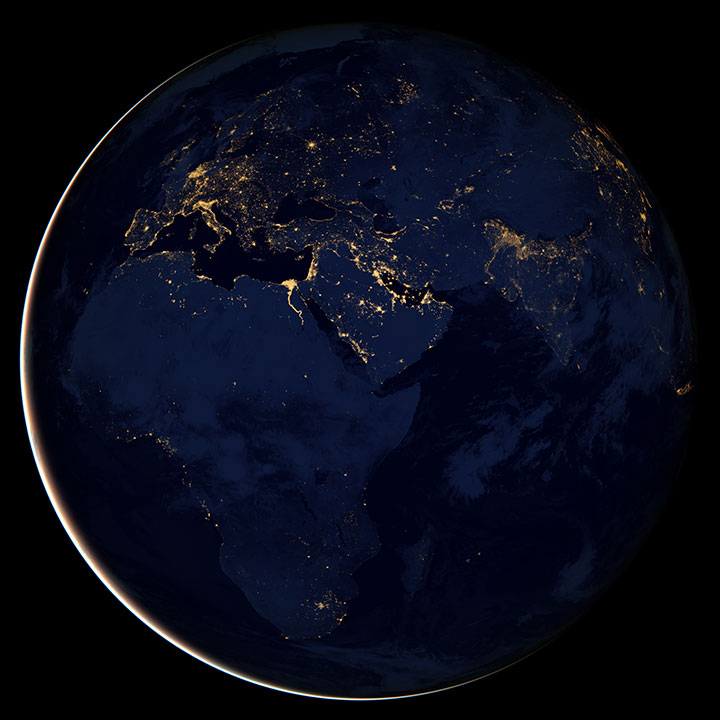
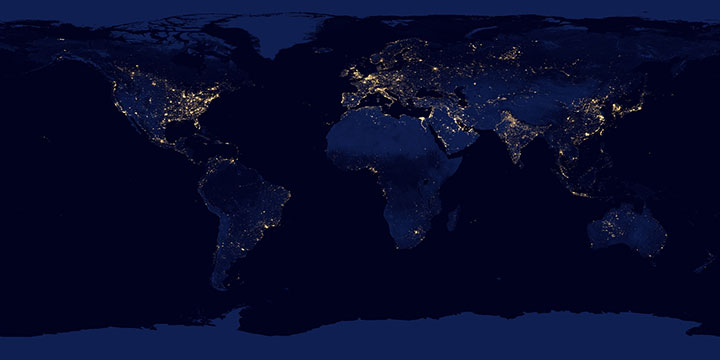
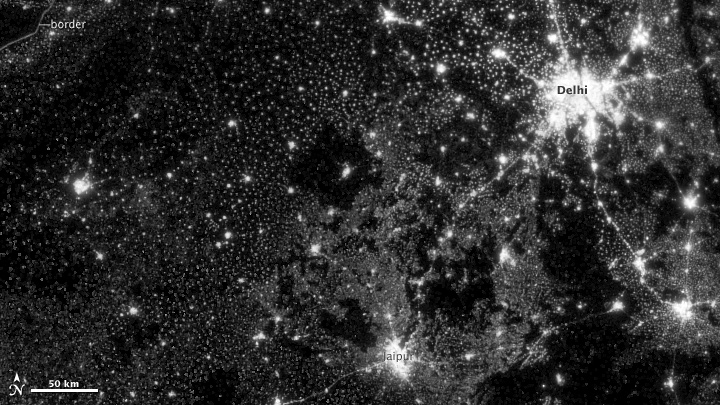
“City lights provide a fairly straightforward means to map urban versus rural areas, and to show where major population centers are and where they are not,” says William Stefanov of the International Space Station program. (View Large Image - NASA Earth Observatory and NOAA National Geophysical Data Center)
Away from human settlements, light still shines. Wildfires and volcanoes rage. Oil and gas wells burn like candles. Auroras dance across the polar skies. Moonlight and starlight reflect off the water, snow, clouds, and deserts. Even the air and ocean sometimes glow.
A handful of scientists have observed earthly night lights over the past four decades with military satellites and astronaut photography. But in 2012, the view became significantly clearer. The Suomi National Polar-orbiting Partnership (NPP) satellite — launched in October 2011 by NASA, the National Oceanic and Atmospheric Administration (NOAA), and the Department of Defense — carries a low-light sensor that can distinguish night lights with six times better spatial resolution and 250 times better resolution of lighting levels (dynamic range) than before. Also, because Suomi NPP is a civilian science satellite, data is available to scientists within minutes to hours of acquisition.
The Visible Infrared Imaging Radiometer Suite (VIIRS) on Suomi NPP can observe dim light down to the scale of an isolated highway lamp or fishing boat. It can even detect faint, nocturnal atmospheric light — known as airglow — and observe clouds lit by it. Through the use of its “day-night band,” VIIRS can make the first quantitative measurements of light emissions and reflections, distinguishing the intensity and the sources of night light. The sum of these measurements gives us a global view of the human footprint on the Earth.
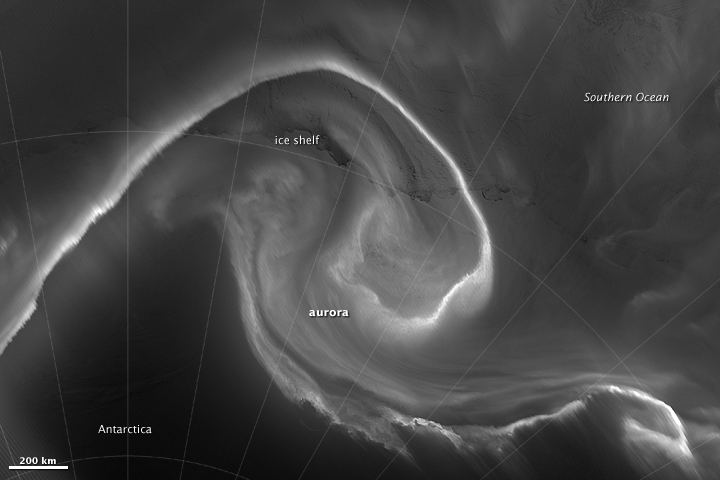
Light from the aurora australis, or “southern lights,” is bright enough to reveal the ice edge in Antarctica’s Queen Maud Land. (View Large Image - NASA Earth Observatory and NOAA National Geophysical Data Center)
“These lights have always been there, but we’ve never had an ability to take full advantage of them,” Miller says. “Now we finally have a way of doing that.”
The original motivation for making low-light Earth observations was practical: military meteorologists wanted to track clouds and storms, smoke plumes, and dust storms at all hours. The Air Force, in particular, needed to provide more accurate and timely forecasts for pilots working at night both over land and at sea.
If combined with thermal (infrared) observations, visible images of moonlit skies can be extremely useful in characterizing the nighttime environment. Clouds are always changing, and there are certain kinds that are more prominent during the night. For instance, fog is more likely to form at night, when the air and surface are cooling and moisture condenses. Convective clouds and thunderstorms tend to form during the day as the Sun heats the surface and destabilizes the lower atmosphere. The properties and distributions of many clouds change rapidly in the transition from sunlight to darkness.
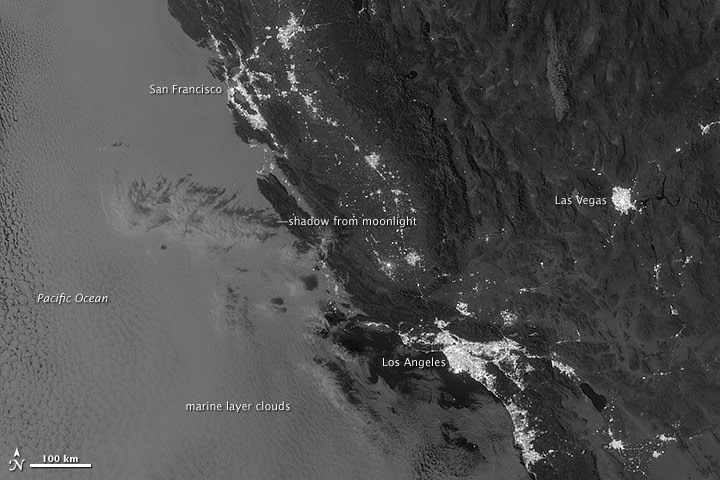
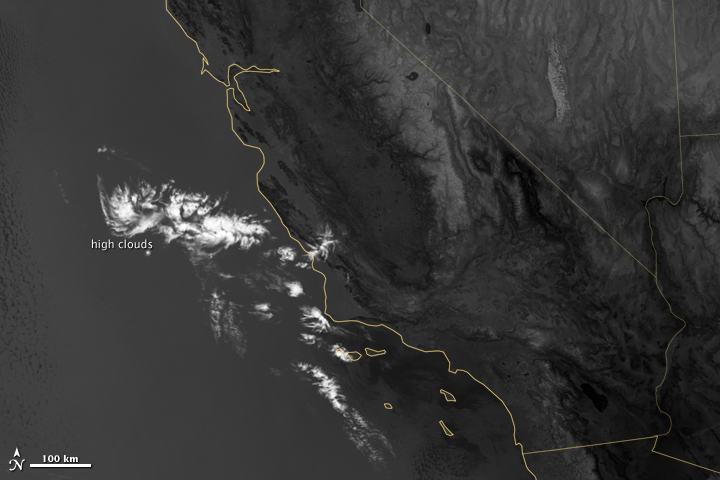
Lit by moonlight, high clouds cast shadows on lower, marine layer clouds off the coast of California in this visible light image (top). Only the high clouds show up in infrared channels (lower) traditionally used for meteorology at night. Low clouds pose serious hazards for air and ship traffic. (View Large Image - NASA Earth Observatory and NOAA National Geophysical Data Center)
Clouds are critical for understanding both daily weather and the long-term climate. As Miller points out, measuring cloud properties — such as water content and particle size — is relatively easy to do during the daytime, but not so much at night.
Since the 1960s, the U.S. Air Force has operated the Defense Meteorological Satellite Program (DMSP), a series of 18 polar-orbiting satellites that observe clouds and other weather variables in key wavelengths of infrared and visible light. Since 1972, the DMSP satellites have included the Operational Linescan System (OLS), which gives weather forecasters some ability to see in the dark. It has been a highly successful sensor, but it is dependent on older technology with lower resolution than most scientists would like. And for many years, DMSP data were classified.
Since just a few civilian scientists have had access to nighttime data over the years, the atmospheric science community was eager to have a night-vision tool of its own. The VIIRS instrument and its day-night band was the answer.
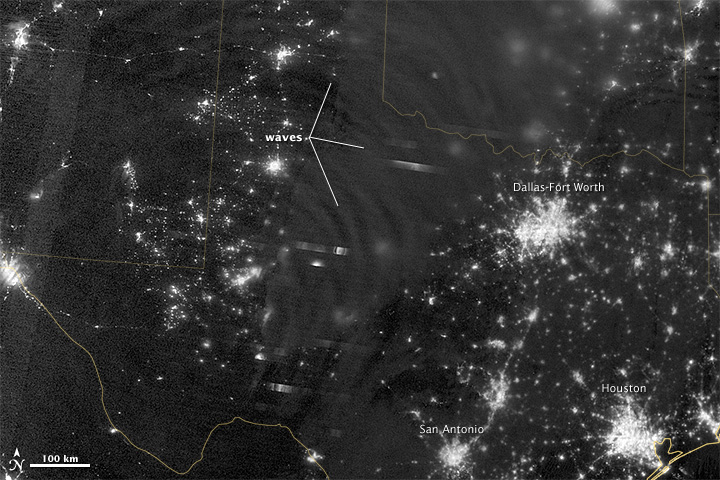
In April 2012, VIIRS spotted waves rippling through the faint airglow in the upper atmosphere over Texas. The waves were provoked by a massive thunderstorm. (View Large Image - NASA Earth Observatory and NOAA National Geophysical Data Center)
“For all the reasons that we need to see the Earth during the day, we also need to see the Earth at night,” says Miller, who started working with DMSP data for the Naval Research Laboratory during the wars in Afghanistan and Iraq. “Visible light information provides a unique ability to detect and characterize atmospheric and surface features that confound thermal emission-based measurements. Unlike humans, the Earth never sleeps; it’s constantly moving, evolving, building up here, and tearing down there. There are many things happening on the nighttime side that we don’t understand because of limited observations.”
“The use of the day-night band by the National Weather Service is growing,” says Mitch Goldberg, NOAA’s program scientist for the Joint Polar Satellite System (including Suomi NPP). “For example, the NWS forecast office in Monterey, California, is now using the day-night band’s exceptional spatial resolution and contiguous coverage to provide higher confidence in issuing marine dense fog advisories.”
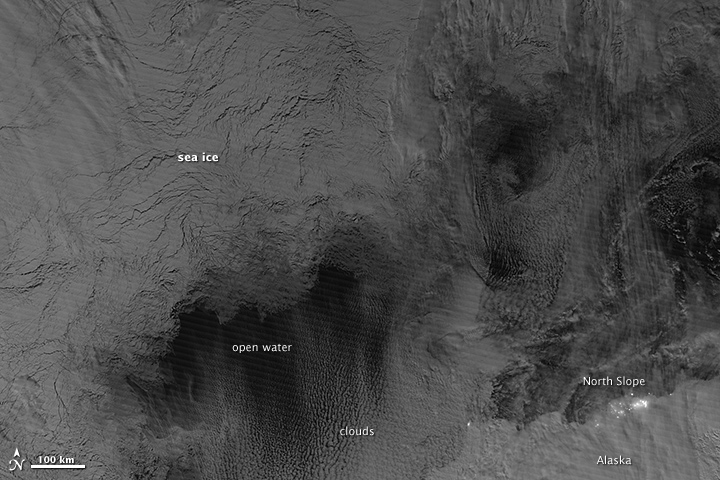
The day-night band uses moonlight, airglow, zodiacal light, and starlight to detect changes in clouds, snow cover, and sea ice in the Arctic. This is an important tool for meteorologists who do not have access to daylight imagery during the long polar night. (View Large Image - NASA Earth Observatory and NOAA National Geophysical Data Center)
Nighttime observations are particularly valuable to people living at high latitudes. Many weather satellites are parked in geostationary orbit over the equator, and the polar regions are far off on the fringes of what they can see. Most other earth-observing satellites only provide visible observations during the daylight portions of their orbits. But the ground tracks of the polar-orbiting Suomi NPP overlap at high latitudes, providing multiple observations and measurements per day of moonlit clouds, sea ice, snow cover, and open waterways for people whose winter nights can last for months.
“As a new capability, I thought everyone would be impressed with the VIIRS day-night band,” says James Gleason, NASA’s project scientist for Suomi NPP. “But the remarkable images and the community response to them has exceeded my pre-launch expectations.”
NPP Suomi and its VIIRS instrument pass over any given location on Earth at roughly 1:30 a.m. and 1:30 p.m. local time each day, observing the planet in vertical strips from pole to pole. VIIRS is a spectroradiometer, detecting photons of light in 22 different wavelength bands and collecting them in a similar fashion to the charge-coupled device in your digital camera.
Data for this map was acquired over 9 days in April 2012 and 13 days in October 2012. It took satellite 312 orbits and 2.5 terabytes of data to get a clear shot of every parcel of Earth’s land surface and islands. (Download Map Views - NASA Earth Observatory and NOAA National Geophysical Data Center)
Unlike a film camera that captures a photograph in one exposure, VIIRS produces an image by repeatedly scanning a scene and resolving it as millions of individual picture elements, or pixels. The day-night band goes a step further, determining on-the-fly whether to use its low, medium, or high-gain mode to ensure that each pixel accurately depicts the amount of light emitted.
“On a hand-held camera, there’s a nighttime setting where the shutter will stay open much longer than it would under daylight imaging conditions,” says Elvidge, who leads the Earth Observation Group at NOAA’s National Geophysical Data Center. “The day-night band is similar. It increases the exposure time — the amount of time that it’s collecting photons for pixels.” If a pixel is very bright, a low-gain mode on the sensor prevents the pixel from over-saturating. If the pixel is dark, the signal will be amplified.
Using this smart technology and improved optics, the VIIRS day-night band is ten to fifteen times better than the OLS system at resolving the relatively dim lights of human settlements and reflected moonlight. Each pixel shows roughly 742 meters (0.46 miles) across, compared to the 3-kilometer footprint (1.86 miles) of DMSP. Beyond the resolution, the sensor can detect dimmer light sources. And since the VIIRS measurements are fully calibrated, scientists now have the precision required to make quantitative measurements of clouds and other features.
Compared to the OLS system (top), the VIIRS day-night band (lower) is at least 10 times better at resolving the relatively dim lights of human settlements. Each VIIRS pixel is 742 meters (0.46 miles) across; OLS has a 3-kilometer footprint (1.86 miles). (View Large Image - NASA Earth Observatory and NOAA National Geophysical Data Center)
“In contrast to the Operational Line Scan system, the imagery from the new day-night band is almost like a nearsighted person putting on glasses for the first time and looking at the Earth anew,” Miller says. “VIIRS has allowed us to bring this coarse, blurry view of night lights into clearer focus. Now we can see things in such great detail and at such high precision that we’re really talking about a new kind of measurement.”
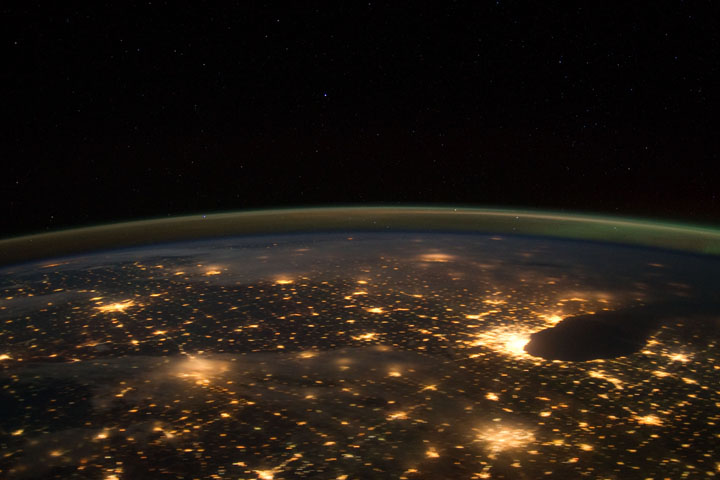
International Space Station astronauts captured this view of the American Midwest on January 31, 2012. Astronaut photography usually has better resolution but less consistency than the VIIRS satellite. (Watch the Video - ISS Crew Earth Observations)
Astronauts also take photographs of the Earth at night and, in fact, their images have even higher spatial resolution (typically 10s to 100s of meters per pixel). “But astronauts are not looking at Earth 24/7/365,” says William Straka, an atmospheric scientist at the University of Wisconsin. Due to the orbit of the International Space Station, Straka adds, they cannot see the surface in the extreme polar regions, though they can observe phenomena in the upper atmosphere. Also, the ISS passes over a given point on Earth every two or three days and at variable times, while Suomi NPP flies over the same point twice a day at roughly the same time. Some scientists are interested in making joint observations between VIIRS and the ISS because of the complementary combinations of spatial resolution, timing, and quantitative accuracy.
The nighttime views collected by the day-night band are already proving useful to meteorologists and atmospheric scientists, who have been observing the dynamics of storms such as hurricanes Isaac and Sandy.
“Having the ability to see at night also helps identify features that could be missed by the other satellite sensors,” says Straka. “We can bring out things like thin plumes of smoke, low-level volcanic ash, areas of fog and other features that otherwise would blend in with the background.”
Chris Elvidge is particularly interested in the view of combustion sources — such as wildfires and gas flares — which glow in different wavelengths than manmade lights. His team can distinguish between the two by simultaneously using visible light and short-wave infrared bands. “We’re detecting much smaller gas flares with VIIRS than we could with DMSP, and we’re able to estimate the temperature and the total radiant output.” Elvidge hopes the measurements could eventually lead to better estimates of carbon dioxide emissions.
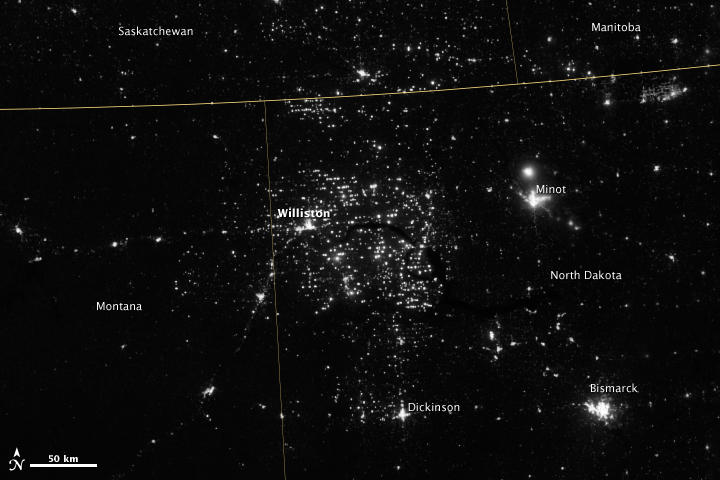
Northwestern North Dakota, one of the least-densely populated parts of the U.S., has been aglow at night in recent years. The light comes from oil drilling and gas flaring in the Bakken shale formation. (View Large Image - NASA Earth Observatory and NOAA National Geophysical Data Center)
But the most popular and poignant use of night-lights imagery remains the study — scientific and aesthetic — of city lights. “Nighttime imagery provides an intuitively graspable view of our planet,” says William Stefanov, senior remote sensing scientist for the International Space Station program office.
“City lights provide a fairly straightforward means to map urban versus rural areas, and to show where the major population centers are and where they are not,” Stefanov notes. “They are also an excellent means to track urban and suburban growth, which feeds into planning for energy use and urban hazards, for studying urban heat islands, and for initializing climate models.”
Elvidge has seen dozens of different uses for city lights imagery. “Artificial lighting is a excellent remote sensing observable and proxy for human activity.”
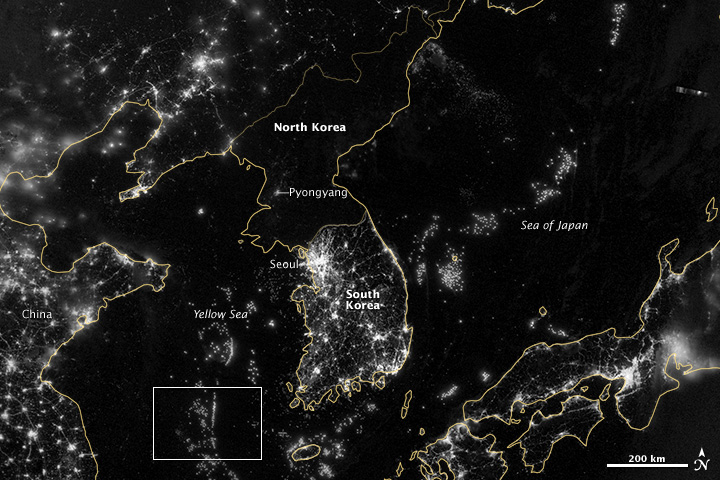
City lights are usually an indicator of where people live, but not on the Korean Peninsula. South Korea’s population is roughly 49 million and the land teems with light. North Korea has 24 million people and hardly any lights beyond Pyongyang. Offshore, the seas glow with the light of hundreds of fishing boats lining up along invisible borders. (View Large Image - NASA Earth Observatory and NOAA National Geophysical Data Center)
Social scientists and demographers have used it to model the spatial distribution of economic activity, of constructed surfaces, and of populations. Planners and environmental groups have used maps of lights to select sites for astronomical observatories and to monitor human development around parks and wildlife refuges. Electric power companies, emergency managers, and news media turn to night lights to observe blackouts.
Elvidge’s research group has been approached by groups seeking to model the distribution of carbon dioxide emissions from fossil fuels and to monitor the activity of commercial fishing fleets, who light up the seas to increase their catch. Biologists have examined how urban growth has fragmented animal habitat. He even learned once of a study of dictatorships in various parts of the world and how nighttime lights had a tendency to expand in the dictator’s hometown or province.
In recent years, Miller, Elvidge, and colleagues have come across unexpected applications for these “dark side” measurements, including the first satellite observations of the mysterious milky seas — the bioluminescence of maritime lore, which causes vast expanses of ocean to glow. And the unanticipated capability of the day-night band to detect reflected airglow and starlight suggests that scientists may never have to be without a visible light measurement, even on nights without moonlight.
City light maps have been used to model the distribution of economic activity and populations, to monitor human development around parks and wildlife refuges, and to observe blackouts. (View Large Image - NASA Earth Observatory and NOAA National Geophysical Data Center)
“Nighttime light is the most interesting data that I’ve had a chance to work with in my career,” says Elvidge, who has been working with nighttime imagery since 1992. “Even after 20 years, I’m always amazed at what city light images show us about human activity.”
“Even as we look toward other planets and the very corners of the universe for the next great discovery,” Miller adds, “these nighttime observations are a humbling reminder that that there are new frontiers of discovery that still await us in our own backyard.”
alert message
