
NASA Tropical Deforestation Research | |||
NASA remote-sensing technology has become the backbone of worldwide efforts to quickly, routinely, and reliably assess trends in tropical deforestation. Since the 1970s, the Landsat series of satellites has provided high-resolution imagery (resolution means “level of detail”) of changes in tropical forests over time. The most comprehensive use of Landsat data to map tropical deforestation has been NASA’s Landsat Pathfinder Humid Tropical Deforestation Project, a collaborative effort among scientists from the University of Maryland, the University of New Hampshire, and NASA’s Goddard Space Flight Center. The project yielded deforestation maps for the Amazon Basin, Central Africa, and Southeast Asia for three periods in the 1970s, 1980s, and 1990s. |
|||
 | |||
Agencies and scientists across the globe continue to use Landsat data to monitor deforestation and to enforce environmental policies. For example, in 2003, the state of Mato Grosso, Brazil, piloted a successful timber licensing system in which property maps were combined with Landsat images to routinely document and issue fines for clearing that exceeded legally licensed limits. As part of a USAID (United States Agency for International Development) initiative called the Central African Regional Program for the Environment, scientists are drawing on experience from the Pathfinder project to improve methods for detecting deforestation and degradation in the Congo Basin. The initiative is producing new decadal forest change maps using Landsat data from the 1990s through 2005. |
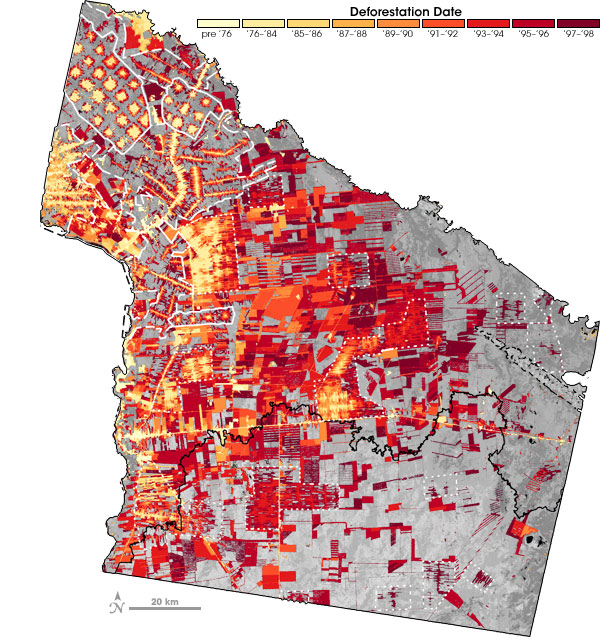
Scientists use data from the Landsat series of satellites, which date back to 1972, to make detailed maps of deforestation over time. With resolutions up to 15 meters per pixel, the data reveal cleared areas as small as an office building. This map shows the progress of deforestation in Tierras Bajas, Bolivia. Areas deforested before 1976 are pale yellow, while areas cleared from 1997–98 are dark red. (NASA map by Marc Steininger.) | ||
 | |||
High-resolution sensors such as Landsat, ASTER (Advanced Spaceborne Thermal Emission and Reflection Radiometer) and ALI (the Advanced Land Imager) provide a detailed picture of deforestation, but the detail comes at a price. The greater the surface detail a sensor can observe, the smaller the area it can view in a single image. This tradeoff between detail and coverage makes high-resolution sensors less suitable for routine deforestation mapping on a global scale. In addition to the problem of spatial coverage, high-resolution data generates large data files that require significant computer and internet resources to analyze, to combine into regional or global-scale maps, and to distribute to scientists and agencies that need them. |
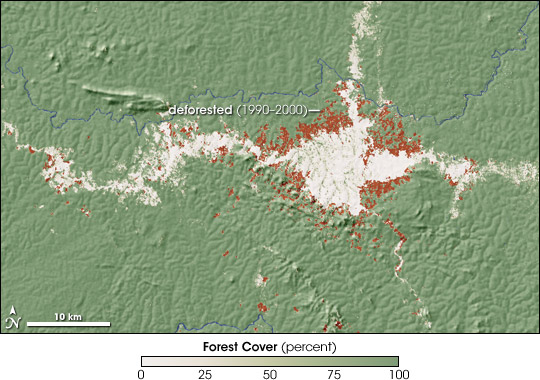
This map shows percent forest cover in eastern Democratic Republic of the Congo. Red areas, expanding outward from the town of Mambasa, show deforestation between 1990 and 2000. (Map by Robert Simmon, based on data from the Decadal Forest Change Mapping Project.) | ||
 | |||
Today, the MODIS sensors (short for Moderate Resolution Imaging Spectroradiometer) on NASA’s Terra and Aqua satellites provide a compromise between level of detail and spatial coverage. The two sensors observe almost the entire Earth each day, providing a daily portrait of tropical forests at a spatial resolution of 250 meters per image pixel. Scientists at the University of Maryland have used MODIS data to develop an annual set of images showing where human-caused changed in vegetation—including deforestation and burning—have occurred in the previous year. The team refers to the product as an “alarm” product, which can draw researchers’ or natural resource managers’ attention to areas undergoing rapid change. By combining the large-scale coverage of the MODIS change-detection “alarm” maps with the more detailed Landsat and ASTER images, scientists are developing automated forest-monitoring systems that can rapidly detect tropical deforestation. |
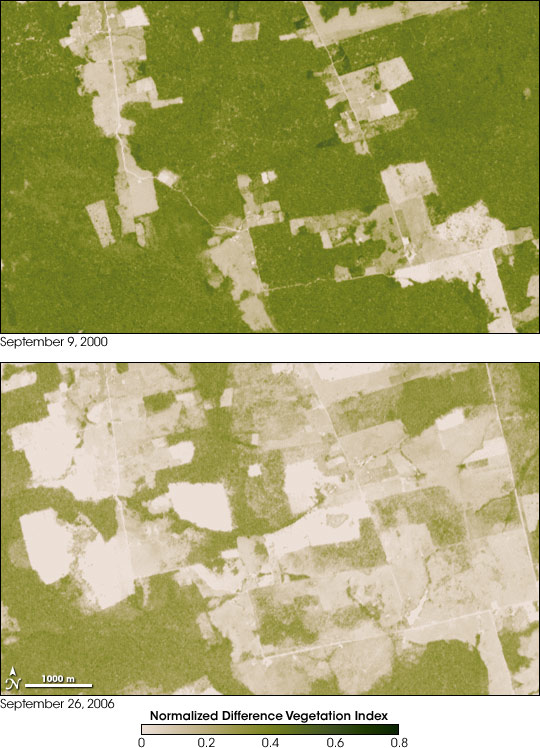
Some areas of Rondonia, Brazil, have been almost completely deforested in just 6 years. This pair of images uses a scale, or index, of vegetation to compare forest area in 2000 to 2006 at the full resolution (15 meters per pixel) of the Advanced Spaceborne Thermal Emission and Reflection Radiometer (ASTER) instrument. Cleared areas (tan) spread from roads cut through the forest (green), a pattern of deforestation typical in Rondonia. (Maps by Robert Simmon, based on ASTER data.) | ||
 | |||
NASA also pioneers the development and testing of new technologies for observing tropical forests, including hyperspectral sensors that observe more than 200 wavelengths of light reflected from the Earth and active sensors such as lidars, which probe the different layers of dense forests with pulses of laser light. In addition to the development of remote sensors and the collection, processing, and distribution of the data they collect, NASA also funds national and international research into the causes and consequences of deforestation. NASA (and NASA-funded) scientists develop predictive models, analyze satellite data for deforestation trends, and lead ground-based research that complements space-based observations. Among the agency’s most important efforts is its participation in the Large-Scale Biosphere-Atmosphere Experiment in Amazonia (LBA). Led by Brazil, the experiment is an international research initiative to understand the Amazon ecosystem, how deforestation and climate change will affect the ecosystem’s functioning, and how the Amazon interacts with the larger Earth system. Under the umbrella of LBA, NASA-funded scientists have refined estimates of the extent of deforestation; developed new ways to identify degraded-but-not-yet-deforested areas; demonstrated the impacts of logging, road-building, El Niño, and fire on tropical forests; and discovered that the seasonally flooded parts of the forests are a major source of atmospheric carbon dioxide. |
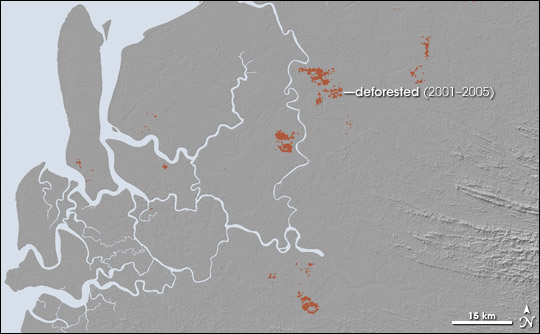
The coastal lowlands of Borneo are another region where deforestation is widespread, often for palm tree plantations. Satellite sensors with a resolution of several hundred meters per pixel, such as MODIS, give a broad overview of deforestation. Frequent observations can sound an alarm to scientists about where rapid land cover change is happening. (Map by Robert Simmon, based on MODIS Vegetation Cover Conversion data.) | ||