Much of the ice that blankets Antarctica is tied up in glaciers that slide slowly toward the sea. Fed by these glaciers, ice shelves form along the Antarctic coast, floating as thick, frozen plates on the sea surface. Every so often, these ice shelves calve large icebergs.
In March 2000, a colossal iceberg calved off the Ross ice shelf, Antarctica’s largest. The iceberg — named B-15 — was 183 miles long and 23 miles wide, or nearly the size of Connecticut. Over the past decade, B-15 has broken into many pieces, and one of them, B-15J, eventually drifted north. By early December 2011, B-15J was floating in the Pacific Ocean roughly 2,400 kilometers (1,500 miles) east-southeast of New Zealand. Having migrated to warmer waters, B-15J began to break apart.
The breakup and melting are exactly what you’d expect under these conditions, but the details of the process still interest glaciologists because the melt and breakup of icebergs may shed light on what will happen to Antarctic ice shelves as climate warming continues. Besides the normal phenomenon of iceberg calving, ice shelves that drift to warm climates can mimic one of the most dramatic things ice shelves can do: rapidly disintegrate.
The Larsen Ice Shelf lies on the eastern side of the northernmost tip of the Antarctic Peninsula. In January 1995, 1,500 square kilometers of this shelf suddenly disintegrated. Seven years later, the Larsen Ice Shelf lost another 3,250 square kilometers of ice. Parts of the Wilkins Ice Shelf also disintegrated, in 1998 and in 2008.
The recent northward journey of Iceberg B-15J has provided the perfect opportunity to study the break-up process in detail.
Because the Moderate Resolution Imaging Spectroradiometer (MODIS) on NASA’s Aqua and Terra satellites sees every place on Earth at least once a day, MODIS proved crucial in tracking the iceberg’s movements in the vast southern ocean. After locating the iceberg fragments via MODIS imagery, staff at the National Snow and Ice Data Center (NSIDC) provided coordinates to a group of collaborators on the Formosat-2 team in Taiwan. Formosat-2 is in a special orbit, and has a highly manuverable satellite platform, enabling it to acquire a one-meter resolution image of anywhere on Earth, once each day. High-resolution imagery from Formosat-2 enables researchers to observe the details of breakup, as if a microscope had been aimed at the icebergs from space.
Warm ocean water doesn’t simply melt icebergs; the water exerts physical force on the ice, reshaping it in complicated ways. Ted Scambos of NSIDC, Douglas MacAyeal of the University of Chicago, and Cheng-Chien Liu of the National Cheng-Kung University in Taiwan have observed in the Formosat imagery evidence of three general processes of iceberg disintegration.
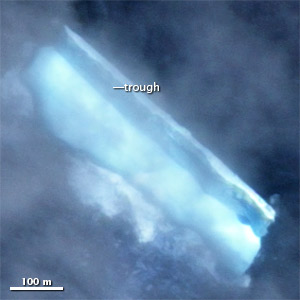
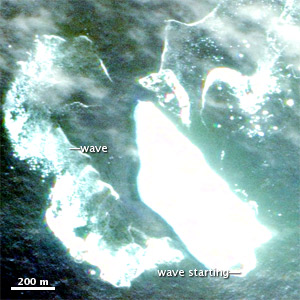
The first process can be described as ice waterline erosion. Heated by the Sun, warm water at the ocean surface preferentially melts away ice near the waterline, and waves lapping against the iceberg accelerate ice removal. Once significant amounts of ice have been removed from the iceberg at the waterline, the buoyant force of the water pushes parts of the iceberg up from below. As the water undercuts the iceberg edge, the upper parts of the berg fall into the sea. This eventually causes the iceberg to split from below, and break off at the edge. The process begins again on the freshly exposed vertical face.
The newly calved portion of the iceberg can present a strange appearance to the satellite sensor, with part of the ice looking like a deep trough.
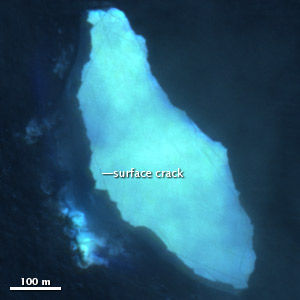
Another process (which may occur at the same time as edge erosion) involves melting and surface cracking. This cracking can arise from stresses that come from floating and flexing that occurs from waves in the open ocean. In a floating iceberg, the buoyant force of the water squeezes the sides of iceberg, causing the ice to arch up a little on top, potentially causing fractures on the ice surface. The cracks usually don’t penetrate deep into the berg, but if the iceberg has migrated into warm conditions, melt water can flow into those fractures, deepening them, and eventually slicing off pieces of ice. Several of the icebergs calved from B-15J showed meltwater flooding their surfaces. This is thought to be a key step in the disintegration process.
Cracks are evident in this iceberg remnant of B-15J.
Although tiny compared to the original, Connecticut-sized iceberg from 12 years earlier, the iceberg fragments observed in December 2011 and January 2012 were still sizable, and when pieces of them calve off, they can make big waves. If those waves slam into nearby icebergs, those icebergs might also calve big pieces, making more big waves. The tendency to calve is enhanced by meltwater-filled fractures. Thus, the initial calving can lead to a runaway process where calving leads to waves that create more calvings on other icebergs (or, in the case of a warming ice sheet, other parts of the ice shelf). Dr. MacAyeal has likened this runaway situation to a mosh pit at a rock concert.
In observing the fragments of Iceberg B-15J, Formosat did not capture icebergs close enough to each other to create a mosh-pit phenomenon. But the sensor did capture calving icebergs and tsunami-like waves.
Graphics by Michon Scott and Ted Scambos, NSIDC. Formosat-2 images provided by Dr. Cheng-Chien Liu, National Cheng-Kung University, and Dr. An-Ming Wu, National Space Organization, of Taiwan. Formosat-2 images acquired December 18, 2011 through January 5, 2012.
It’s been a really active time for the Earth Observatory and volcanoes. In the past three weeks, we’ve posted images of a night-time eruption of Shiveluch, ongoing activity at Puyehue–Cordón Caulle, daytime activity at the Kizimen Volcano, and my own favorite, a brand new island in the Red Sea. And those are just the images we published!
In recent weeks, we had a good shot of activity at Kilauea, but we skipped it since it only had Halema’uma’u activity — which is much like previous images and not the new ocean entry point, which we’ve yet to glimpse in cloud-free satellite imagery. We received an excellent ALI scene of the submarine El Hierro volcano (which we published) and then the next day we received an image of the same volcano from Landsat 7 (which effectively got scooped by ALI).
Another of the moderately recent and interesting images of volcanoes we didn’t use is a very nice ALI shot of the Cerro Hudson volcano in Chile.
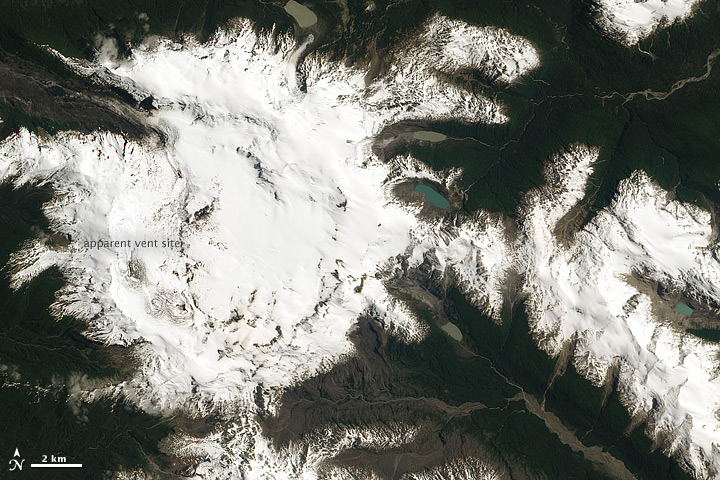
We do have a good reason for not using the image. Notice the volcanic activity? Yeah, we didn’t see anything either. What makes this image interesting (to me anyway) is that just two weeks earlier, it looked like this:
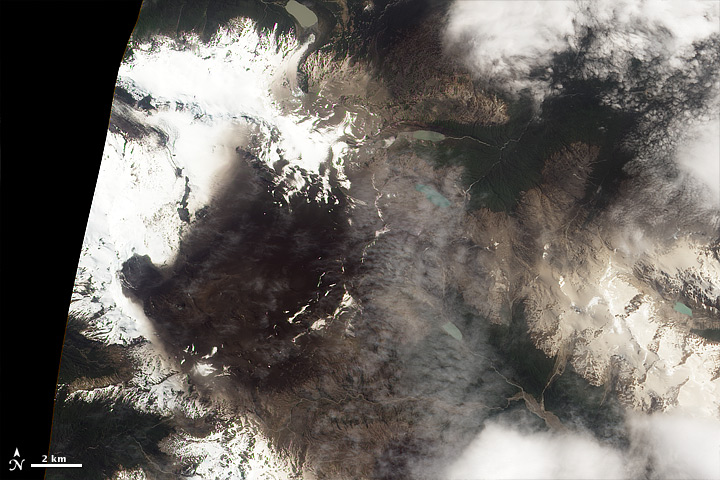
We did publish that one. There’s actually not much in the way of activity in that one either, but in the published image, you can see a lot of ash that’s fallen on the ground from activity in October at the volcano.
Just two weeks later, with no new activity, almost all the ashfall seems to have “disappeared.” Fresh snow fell and covered much of it. Also, we got a much better shot with ALI of the volcano, getting a very nice view of the entire caldera, the glacier draining it out of the northeast, and forests in the alpine valleys. The ashfall was nowhere near as extensive and damaging as the Puyehue eruption, which at one point spewed out ash that circled the globe.
The new feature story, Seeing Forests for the Trees and the Carbon, discusses the need to form a three-dimensional picture of the world’s forests. Such a three-dimensional picture includes tree canopy height (below). Although canopy height in the Amazon Rainforest doesn’t match those of the Pacific Northwest or Southeast Asia, it still far exceeds the canopy height of Western Europe.

The height differences call to mind the adventures of a European naturalist who set out from Amsterdam in 1699 and spent two years exploring the jungles of Suriname. Bugs were the main attraction; namely, bugs that transformed from caterpillars into moths and butterflies. The scientist became one of the foremost experts on insect metamorphosis, braving tropical fevers, poisonous flora, slave rebellions, and a near shipwreck. What people found most audacious about the expedition was the age (52) and gender of the person who undertook it.
Maria Sibylla Merian was born in 1647 in Frankfurt, Germany, to a family of printers. Besides helping with the family business, she nurtured her interest in bugs from an early age. By the late 1690s, she was living in the bustling metropolis of Amsterdam. Among her many contacts were missionaries who were converting “heathens” half a world away. Merian was invited to visit, giving her the chance to study insects and plants that few other naturalists had ever seen. Teenage daughter in tow, she crossed the Atlantic.
Once she arrived in Suriname, however, Merian faced a challenge she probably hadn’t anticipated. In Germany and the Netherlands, she collected caterpillars from gardens designed for human enjoyment. That meant that her prized bugs could be found on plants that were waist high at most. The tropical jungle was different—not just different from the well-manicured gardens, but from any forests she might have known.
Long before Merian’s time, Europeans had cleared the land on much of their continent, making way for farming and pasture. Suriname, however, was covered in dense forest, with trees soaring 150 feet skyward. Bugs lived high over Merian’s head, completely out of reach most of the time. And in the vertical yards of tree trunk overhead, different insect communities thrived at different levels: The bugs living 30 feet above ground might be completely different from bugs living 60 feet above ground.
She made the most of the situation, collecting and drawing the insects that were within reach, and studying detritus that fell from the forest canopy. In one instance, she even had a mighty tree chopped down to collect its caterpillars and cocoons. Illness forced Merian to cut short her trip, originally planned for five years. She did, however, return to Europe with enough samples, drawings, and notes to assemble Metamorphosis Insectorum Surinamensium (Insects of Surinam), published in 1705.

Image credit: UF Digital Collections. Some rights reserved.
The same tall tropical trees that occasionally hampered Merian’s research continue to provide homes and food for insects, birds, and mammals today. While Merian could only gaze at the trees from the ground, modern satellite sensors can monitor the trees from above, gauging their height, and helping scientists understand how much carbon they hold.
Further reading: Todd, Kim. (2007). Chrysalis: Maria Sibylla Merian and the Secrets of Metamorphosis. Harcourt, Inc., Orlando.
On January 11, 2012, Google celebrated the 374th birthday of geology pioneer, Nicolaus Steno, with a special Google Doodle.
Steno was a 17th-century anatomist and pioneering geologist. After dissecting a shark head, he realized that “tongue stones” — believed to belong to snakes turned to stone — were actually shark teeth.
In Steno’s era, many people believed fossils were just weird objects created by rocks. But he realized that fossils were the remains of ancient organisms.
Besides studying fossils, Steno examined rocks around Tuscany. He found that they were deposited in layers, with older rocks underlying newer rock layers. This basic principle of geology helped later scientists piece together the history of life on Earth.
You can learn more about Steno’s life and work in this Earth Observatory feature story published in 2004.
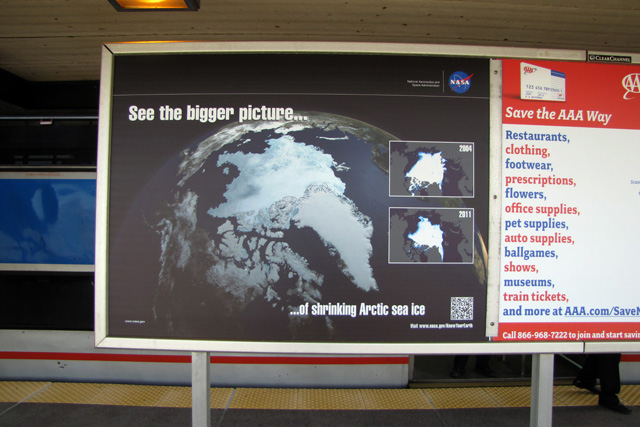
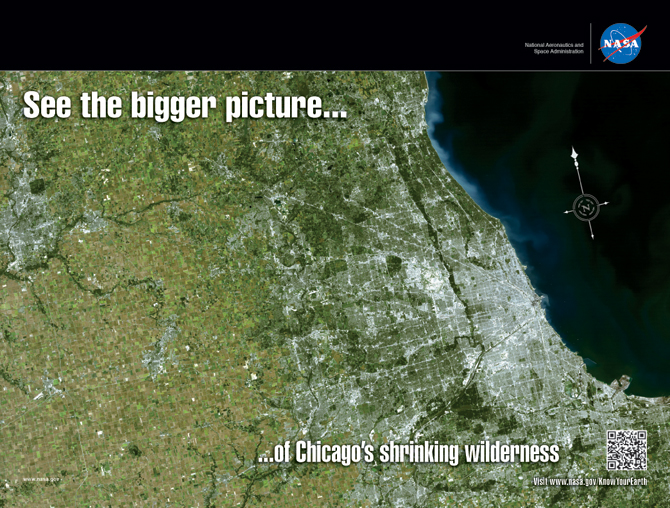
For a month in the fall of 2011, NASA staff conducted an experiment of a different kind. They shared satellite images and maps with Chicagoans, but not in a classroom or a museum. The images of Earth were posted at malls, at bus and train stations, in O’Hare Airport, and on roadside billboards. The experimental question was: would compelling images of the city and planet provoke people to learn more about earth science?
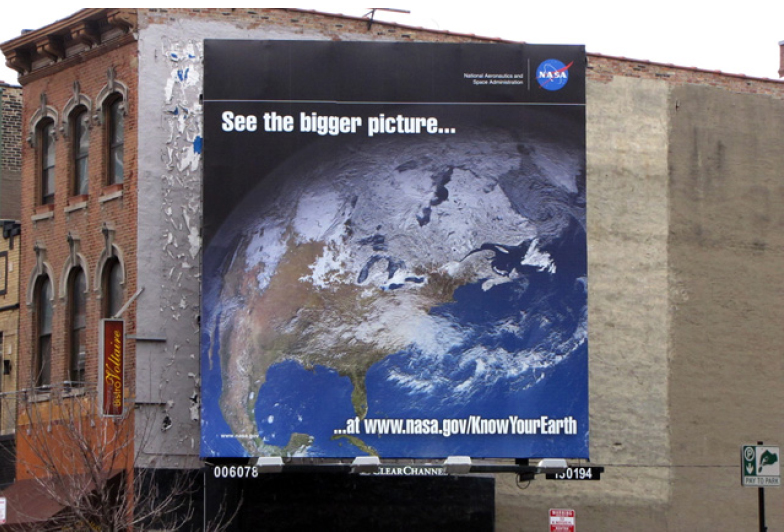
“We wanted to try and grab the attention and interest of an ‘on-the-go’ audience, one that might not seek out NASA information unless they had a primer,” said Brian Campbell, a NASA Earth science education specialist who led the effort. “The health of our planet is in jeopardy, and we want the public to know why and how we are trying to understand what is happening.”
The idea was to meet Americans where they live; that is, to bring science to the people, instead of waiting for the people to find science. Twelve NASA missions collaborated on images, messages, and strategic development of the Know Your Earth public awareness campaign. (Click on the link to see all of the images.)
A secondary goal was to make the public aware that NASA does Earth science. So many Americans think the agency is just human spaceflight, big astronomy, and planetary probes. But in fact NASA is one of the world’s largest funders and employers of earth scientists.
Know Your Earth first launched in 2010 with the premiere of video segments shown in 291 movie theaters across the United States. The full-length video is available here on YouTube. Below is the shorter teaser that also hit theaters in July 2010.
[youtube Zfd0XPMP0d4]
Results and evaluations of the fall 2011 awareness campaign are still being compiled, but early reactions are positive. So what do you think of the Know Your Earth campaign? Does it make you want to learn more? Where should they take this project next? See www.nasa.gov/KnowYourEarth
It’s Earth Science Week. What are you doing to celebrate?
Our colleagues within NASA and at other institutions have organized a series of educational and outreach activities this week that showcase our science and the people behind it. Some highlights include:
+ A webcast with NASA’s chief scientist, Waleed Abdalati, from 1-2 p.m. Eastern Time on October 12. Teachers and students are invited to join Waleed Abdalati to share stories and perspectives on our ever-changing Earth. Participants can email questions during the webcast. Visit http://dln.nasa.gov/dln and scroll down to the DLiNfo Channel Webcasts to link to the webcast (no registration necessary).
+ Profiles of women making a difference in Earth science at http://women.nasa.gov/earth-science-week-special. The stars include: Cynthia Rosenzweig, who leads a group studying the impacts of climate change; Erika Podest, who studies wetlands and the global carbon and water cycles; Erica Alston, who focuses on fisheries and atmospheric science, including air quality; and Claire Parkinson, project scientist for the Aqua mission and a climatologist studying sea ice.
+ An introduction to the next Earth-science satellite, NPP, set to launch later this month. The National Polar-orbiting Operational Environmental Satellite System Preparatory Project will play a key role in studying climate change. Learn more about NPP and its polar bear mascot NPPy at http://npp.gsfc.nasa.gov/kids.html.
+ Short videos introducing Earth Science Week and NASA’s role in studying Earth, as well as educator resources and programs. Visit http://climate.nasa.gov/esw2011
Organized by the American Geological Institute and its federal and private partners, Earth Science Week was created in 1998 to help the public gain a better appreciation for the science and stewardship of our planet. The theme this year is “Our Ever-Changing Earth,” something you can observe daily here on the Earth Observatory.
“We invite you to join us online, explore our changing planet, and share this work with your students, family, and colleagues,” says Eric Brown de Colstoun, a scientist who also coordinates Earth science education for NASA’s Goddard Space Flight Center. “You can also choose to reflect on how lucky we are to live on this beautiful and ever-changing planet, the home base from which we carry out our many explorations into the universe.”
More information about Earth Science Week can be found at http://climate.nasa.gov/esw2011/. Archived events from 2011 and years past can be found here.
Vishnu, an Earth Observatory reader, posed a great question after viewing “The Six-Million Mile View of Earth and Moon“:

“I’ve never seen a photo like that. Was the background beyond Earth ‘photoshopped’ to remove background stars, or is that angle so narrow and the background space so coincidentally ’empty’ that no visible stars are there to be seen?”
Our colleague D.C. Agle from the Jet Propulsion Laboratory worked with the Juno science team to provide this answer:
“The exposure time for the image — it’s actually three images: red, green and blue — was too short for any stars to be seen. Earth and the Moon were bright enough that a short-duration exposure was all that was needed. The brighter an object is, the shorter the exposure time required to capture an image of it. It’s similar to why you don’t really see stars in Apollo photos from the moon – the subjects being photographed were so much brighter than the background stars that the exposures weren’t long enough to capture the stars.
Here are two examples from the Cassini mission to Saturn showing long exposures that did capture stars. In both cases, the stars show up as streaks because of the relatively long exposures required to capture a good image of the moons.
+ Tethys in Eclipse
+ Iapetus by Saturn Shine
Cassini stays locked onto its target and actually turns very slightly during the exposures. Meanwhile the stars move slowly across the sky, and their images are smeared out as streaks.
Interestingly, the Voyager spacecraft took this remarkable image from about 7 million miles away in 1977. The difference is that Voyager was a survey and flyby mission, and its cameras were like long-range telescopes. Juno is an orbiter that will get extremely close to Jupiter every 11 days, and its camera is designed for that. It will take amazing wide-angle views from only a few thousand miles above the cloud tops. So that’s why Juno’s camera has a field of view about 130 times wider than Voyager, and thus why Eath seems so much smaller even though Voyager was a little farther away when it took its Earth-moon image.”
******************************************
Along those same lines, another reader (Norton) pointed out the lack of stars in a shot closer to Earth: “I was curious to see stars in this image of earth, yet in most other images the stars aren’t visible.
In one of your images of the day a week or two later, there are no stars visible. Is this solely due to how much light is captured by the camera and the stars are a weaker source; or is something else occurring that the stars aren’t visible?”
Our colleague Will Stefanov of the ISS Crew Earth Observations Team at NASA’s Johnson Space Center offered this explanation:
“It’s dependant on the camera settings, and to some degree the camera itself. The Nikon D3 cameras the astronauts often use are designed to be more sensitive in low-light situations, so you are more likely to capture some bright stars in the imagery. Images taken with long exposures and/or wide apertures will also record more starlight due to the greater amount of light on the camera sensor. Shorter exposure imagery of the Earth — the majority of daytime images — typically do not record stars as they are too dim compared to the brightness of the planet.
The astronauts generally follow a set procedure, with defined camera settings, for Crew Earth Observations imagery. But occasionally they will change those settings for a specific purpose or for personal experimentation. This can lead to images in which the stars are more visible for the reasons described above.
Floods Devastate Pakistan
For the second straight year, torrential monsoon-driven rains have swamped portions of Pakistan. The AFP reports that more than 200 people have been killed and thousands have fled their homes. Researchers associated with the MODIS instrument on the Terra satellite recently posted an eye-opening set of images that shows the condition of the swollen Indus River in early September in comparison to more normal conditions. Meanwhile, NASA researcher William Lau has published an interesting new study that shows last year’s floods in Pakistan were closely linked to large fires that occurred in western Russia around the same time.
Climate Science Marathon
Kick back and break out the popcorn. Al Gore’s Climate Reality Project has posted 24 hours of presentations and roundtable discussions about climate change. Reactions to the event have been predictably diverse. Commentators who regularly question the veracity of climate change have taken a dim view of the presentations, while those who regard climate change as an urgent threat have welcomed them. Despite having an unusually high tolerance for PowerPoint, I’ll admit that I have about 22 hours to go before getting through all of them. One segment caught my eye: NASA’s Drew Shindell explains how physics suggests a warming world will produce more extreme weather. Take a look starting at 37:35 of the Cape Verde video.
The Extreme Weather Connection
Speaking of extreme weather and climate science, Nature has an interesting piece about how some climate scientists have become less reluctant about linking extreme weather events to climate change. Nature recently published two studies highlighting just such connections. The journal also reports that a group of British and American researchers are laying the foundation for a system to assess in near-real time how much specific weather events are connected to climate change. “Attribution of extremes is hard — but it is not impossible,” Gavin Schmidt of the Goddard Institute for Space Studies told Nature.
[youtube 6Hv4S90UOBY]
See the Shrinking Arctic Sea Ice
The National Snow and Ice Data Center released preliminary numbers on the minimum extent of Arctic sea ice, calling this year’s minimum the second lowest on record. Other groups relying on slightly different data report this year’s sea ice minimum is a record low. At the end of the day, whether this year goes down as the lowest or the second lowest ice extent isn’t particularly important. The long-term trend is abundantly clear. Sea ice is retreating, and fast. NASA hasn’t weighed in officially with its numbers, but Goddard Space Flight Center’s Flickr page has posted striking video and stills of the 2011 ice loss.
Mars Research Has Earthly Applications
Looks like the time might be coming to trade in that dowsing stick for low-frequency sounding radar. The Jet Propulsion Laboratory announced that its scientists, in conjunction with colleagues from the Kuwait Institute for Scientific Research (KISR), have used sounding radar — developed for a mission to Mars — to successfully locate underground aquifers, probe variations in the water table, and identify locations where water flowed into and out of the aquifers. “This is a critical first step that will hopefully lead to large-scale mapping of aquifers,” said Muhammad Al-Rashed, director of KISR’s Division of Water Resources. Here’s a good video overview of the story.
Look Up: Here Comes UARS
NASA’s bus-sized Upper Atmosphere Research Satellite, or UARS, is poised to reenter Earth’s atmosphere on September 23rd or 24th. Much of the 12,500-pound (5,700-kilogram) satellite will burn up upon reentry, but Johnson’s Orbital Debris Program cautions that some pieces of the spacecraft could survive. Nobody has ever been injured by falling space junk, nor has any significant property damage ever occurred. Still, if you’re worried about being pelted, the Joint Space Operations Center of U.S. Strategic Command at Vandenberg Air Force Base will be posting frequent updates detailing when are where pieces might fall as the reentry date approaches. Meanwhile, read up on the considerable contributions the satellite made to science here.
Written by Jesse Allen, EO data visualizer…
Recently while doing something work-related (yes, really!), I stumbled upon a fascinating story. I found the Gates of Hell.
It turns out that they are in Turkmenistan. They were built — in a manner of speaking — by the former Soviet Union in 1971.
In 1971, Turkmenistan was a part of the Soviet Union. Not far from the village of Derweze (in Russian, it is Darvaza), a Soviet drilling rig hit an underground cavern, which subsequently collapsed and formed a deep pit, almost a hundred meters across. It was spewing toxic gases.
In order to contain the hazard, the gases were set alight, with the expectation that the gas would burn off in a few days. A few decades later, though, the pit is still on fire.
Natural gas continues to seep into the crater at a significant rate, sufficient to keep the lights on much the same today as when the match got tossed in (figuratively speaking). The Darvaza Gas Crater has since come to be nicknamed The Gates of Hell, and it has proven an unlikely and unusual tourist destination in the midst of the Kara-Kum Desert. Every desert really needs gas heat, after all.
Some have written and railed about what an environmental travesty it is to have all of that natural gas burning off. And certainly 40 years of open fossil fuel burning seems like no minor matter. But a little perspective is in order. It is worth pointing out that the Gates may well be no more dramatic than a single large gas-fired (or perhaps a moderate coal-fired) power plant, of which there are a great many in operation for 40 years or more around the world.
The pit might also be compared to any of a number of natural features, such as active volcanoes. There’s a constantly molten pit of lava emitting hot, toxic gases at the summit of Nyiragongo, for example, and it’s just as dramatic (maybe more) as the Gates of Hell.
Industrial accidents, malicious intent, and even natural events have lit fires that have burned for comparable periods elsewhere. Centralia, Pennsylvania, had to be permanently evacuated, for example, after a 1962 trash fire reached an underground coal seam that has been burning ever since. (Poisonious carbon monoxide still seeps out of the ground.) Retreating Nazi sailors set the Mine #2 alight near Longyearbyen in Norway’s Spitbergen Island in 1944, and that fire burned for some 20 years. Wikipedia offers a whole catalog of coal seam fires, some of which have been burning for a century or longer!
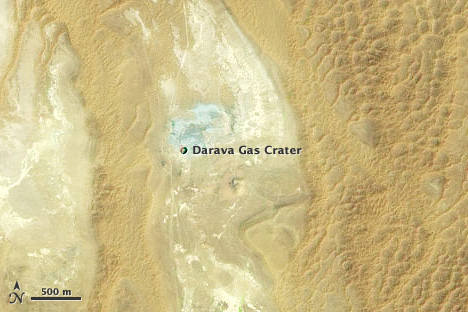
It’s hard to know when, or even if, the Darvaza Gas Crater might go out. But what I do know is that the Gates of Hell are not so interesting from a satellite perspective. The 100-meter-wide crater is certainly discernable in the moderately high resolution Advanced Land Imager (image above), and infrared emissions show heat coming from the flames.
But who knew the Gates of Hell would turn out to look, well, boring?
References
The Door to Hell – Burning Gas Crater in Darvaza, Turkmenistan
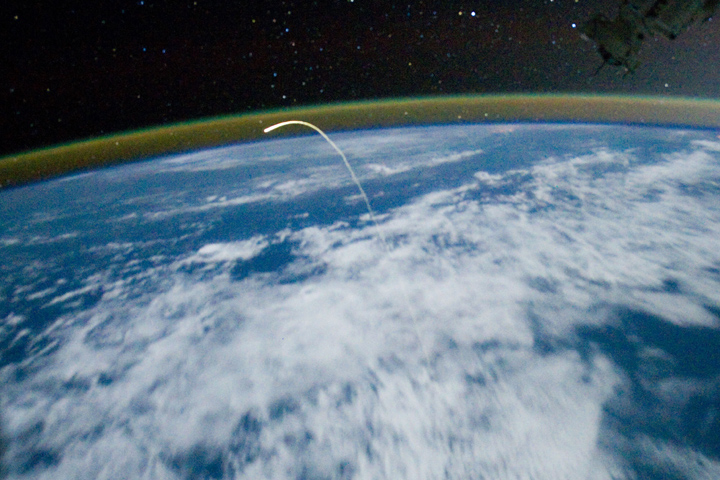
As the world reflects on the 10th anniversary of the September 11, 2001, attacks on the United States, the Earth Observatory team has been struggling with what to say and do. Like so many other media outlets, we felt compelled to say something, to show something.
Our data visualization team found this: a previously unpublished view of New York City on September 12, 2001 (below). It was captured 10 years ago today by the Advanced Land Imager on NASA’s Earth Observing-1 satellite. (Other satellite views are here and here. The space station view is here.)
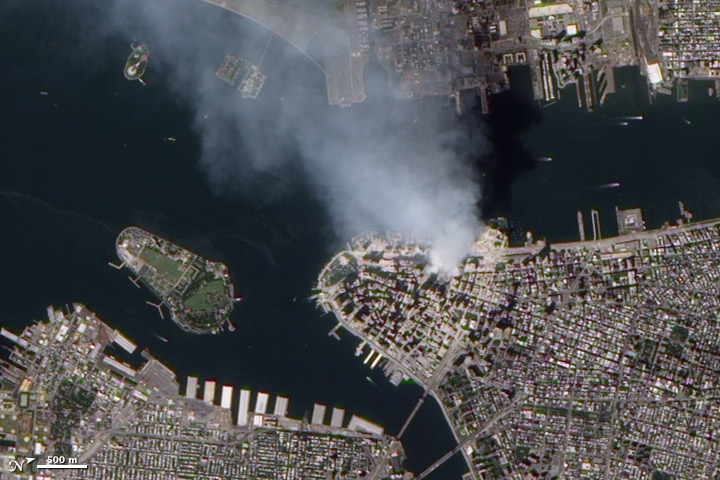
But all of us were left cold by it. Science left us cold.
I have been searching for several days for an old quote, but it eludes me. The gist of the thought is this: You start with a group of organisms — robins, dolphins, ants, humans — and you have life to study, life force to study. With scientific tools, you can study individuals…dissect down to
anatomical systems (circulatory, neurological, etc.)…then to organs…tissues…cells…mitochondria and nuclei…compounds and molecules…atoms…electrons, protons, and neutrons…quarks. But somewhere along the way, you lose the “life” of the thing. (Lewis Thomas? Bill Bryson? Richard Feynman? If you know the source, please tell us.)
So it is sometimes with satellite photos. We can learn a lot about our environments, our niches, our human fingerprints on the Earth. But sometimes you lose the life along the way. When we thought about running the above photo as an Image of the Day, it felt unworthy of the moment. You can see a city, but you can’t see the loss, the humanity, the soul.
But science and satellites can show us something: We all have one home that we share. It is a beautiful, fragile, awe-inspiring place.

Songwriter Julie Gold captured the thought in “From a Distance” (performed here by Nanci Griffith):
From a distance the world looks blue and green,
and the snow-capped mountains white.
From a distance the ocean meets the stream,
and the eagle takes to flight.
From a distance, there is harmony,
and it echoes through the land.
It’s the voice of hope, it’s the voice of peace,
it’s the voice of every man.
alert message
