In mid-September 2012, the National Snow and Ice Data Center (NSIDC) announced that Arctic sea ice had reached a new record minimum — 3.41 million square kilometers (1.32 million square miles). The previous record low came in September 2007 at 4.17 million square kilometers (1.61 million square miles). The 1979–2000 average minimum ice extent was 6.70 million square kilometers (2.59 million square miles).
If you are not used to tracking the ice pack at the top of the globe, this may seem like just a string of big numbers. So NSIDC’s Walt Meier offers another way to understand the shrinking ice cap.
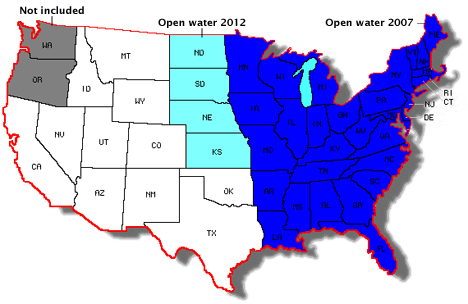
In the 1980s, the average extent of sea ice extent in the Arctic was roughly equal to the area of the contiguous United States, minus Washington and Oregon. In September 2007, the sea ice minimum dropped so far below the 1980s average that the area shaded in blue became open water, and the white and turquoise areas would have remained ice-covered. The September 2012 minimum was lower still, such that the Dakotas, Nebraska, and Kansas were also ice free, along with all of the states to the east.


Eigentlich gibt es nur die Erklärung Erderwärmung. Es gibt auch eine andere, die überliefert wurde. raubau mit der Natur wehrt sie sich. heißt heute. bei Erdölbohrungen entstehen Hohlräume, die werden irgendwie gefüllt. Aber wie? Die natur kommt aus dem Gleichgewicht. Der Mars erinnert mich an die Serengeti,Afrika. der Regen bleibt aus der Wind treibt den Sand weiter. Das Grundwasser geht zurück. Was ist da passiert?
Dies hat nichts mit der “Erderwärmung” zu tun, die schon seit 14 Jahren nicht mehr stattfindet. Auch in der
Arktis sind die Temperaturen zurückgegangen. Der Eisschwund wurde durch warme Wind- und Meeresströmungen hervorgerufen und das ist in der Vergangenheit schon öfter passiert. Eine normale,
natürliche Erscheinung.
Why wasn’t the reason for the record low Arctic sea ice over the period from 1979 to 2012 given? There was an Arctic cyclone for 5 days over the North Pole in mid-August that broke up the ice and sent it down to warmer waters where it melted. This had nothing to do with so-called global warming which has been at a stand-still since 1998.
We only had daily sea measurement via satellite since 1979. There most likely was smaller Arctic sea ice during earlier periods; but there was no easy way to make measurements. The U. S. Weather Bureau reported in 1922 open water above Norway to withing 580 miles of the North Pole. Sea water was 60 degrees at Spitzbergen. A circle with an area of 1.32 million square miles would have a radius of 650 miles.
So the low Arctic sea ice this year has happened before and no big deal. NASA failed to report this September the Antarctic had a record high for sea ice. None of these events can be tied to carbon dioxide from burning fossil fuels. NASA is doing its usual ploy of trying to promote burning fossil fuels is a danger. The danger is not using fossil fuels and plunging the world’s economy into a depression.
James H. Rust, Professor of nuclear engineering
When you use SI units, such quantities become easy to handle:
6.7 Mm2 – average
4.2 Mm2 – previous record
3.4 Mm2 – new record
SI units do away with the practice of saying “thousands of”, that makes quantities seem too big to handle.
Seventy years ago when I was in Sunday school, if we did something good we got a Gold Star. NSIDC’s Walt Meier should get a Gold Star for this article.