The Earth Observatory has published its last Image of the Day on this website. Please join us on our new home at science.nasa.gov/earth/earth-observatory.
Challenges and Limitations to Using the GRACE Technique |
|||
| GRACE measures changes in Earth’s gravity field by measuring the distance between the two satellites every five seconds. In a way, you could say the GRACE satellites only have eyes for each other; they aren’t really looking at the Earth. Using raw GRACE measurements, all the scientists can tell is that at a specific point above the Earth, the two satellites were closer together or farther apart than they were five seconds ago. They can’t tell much else; the raw data is just a distance measurement and a position over the planet. Hundreds of kilometers below them, something above, below, or beneath Earth’s surface caused gravity to pull a little harder or a little weaker on the satellites as they moved overhead, and the scientists have the challenge of figuring out what caused the change. So what is that something? According to Watkins, “It could be almost anything,” and that makes the job of sorting out the signal quite difficult. There are rapid and slow changes caused by everything from the shifting of water in the oceans, to the movement of water vapor and other components in the atmosphere, to the shifting of solid rock in the lithosphere. Other changes can occur due to tidal effects caused by the Sun and the Moon. The different topographic features along the satellite’s path—mountain ranges, deep ocean trenches, rock formations rich in heavy, dense metal—also influence the gravity field. The gravity field can even change in response to topographic features that have not been present for millennia. For example, the Earth’s crust is still “rebounding” from the massive weight that was removed when the glaciers retreated at the end of the last ice age. Before the hydrologists can use the data, the GRACE Science Team has to sort out all of these different effects. |
|
||
|
|||
There are some gravity effects that change extremely rapidly, some almost minute by minute. This might include ocean tides or weather systems moving across the planet. Sometimes the variability in the gravity field over one month can be as large as the average value for the month, but GRACE can’t detect this variability. When GRACE collects data, it doesn’t scan the whole Earth at once. It takes about a month for the whole Earth to be sampled. This means that GRACE cannot view the Earth quickly enough to measure the fastest changes in the gravity field from space. Therefore, in order to prepare the gravity solution for use in hydrological applications, the changes that occur over a timescale shorter than one month, mostly related to the atmosphere and ocean, have to be accounted for using models. Otherwise, the estimate of the monthly average gravity field would not be as reliable for use by the hydrologists. The monthly average gravity field maps provided to hydrologists like Wahr and Rodell have been corrected for these rapid variations. However, there are still lingering effects of atmospheric and oceanic phenomena that change over monthly intervals or longer that must be taken into account before they can isolate water storage change. Using model simulations of the atmosphere, ocean, and solid Earth, the hydrologists can clean up any leftover, non-water-related-effects, and what they end up with is a “corrected” gravity field that represents only the effects of water movement. |
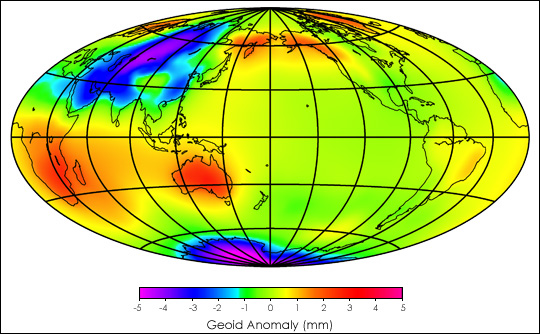
The changes in Earth’s gravity signal caused by water storage can be overshadowed by changes caused by movements in the atmosphere and oceans. The image above is the result of a computer model that predicted where and by how many millimeters these atmosphere and ocean movements would have increased or decreased the average gravity signal in August 2002 compared to the yearly average for 2001. Yellows, oranges, and reds are places where the average August gravity signal was higher than the 2001 average, while greens, blues, and purples show where it was lower. (Image credit: Paul Thompson / UT-CSR) | ||
|
|||
| But, there is still the issue of how to account for the influence of the Earth’s topography. The influence of the geographical variation in the Earth’s mass on the gravity field is much larger than that of water storage, and errors in the solution for the mean field could obscure the smaller water storage signals. Hydrologists get around this problem by comparing GRACE observations from two different time periods and assuming that any change observed is caused by water storage. After all, we can pretty much count on the fact that if a mountain was in a particular place last month, it will be in the same place this month, and thus its effect on the gravity field will be the same from month to month. By looking at the average monthly gravity field from two different time periods and taking a difference between the two, the part of the signal that is more or less constant over short time intervals cancels out and what remains is the change in the gravity field caused by water storage change. Wahr and Rodell can then relate this value to an equivalent water level change in a specific region by using a simple conversion that describes how much water it would take to produce the mass change that GRACE observed over the region. Thus, this GRACE technique is not a way to measure exact water storage amounts from space, it can only tell us how water storage changes with time. Therefore, this technique cannot be used to measure how much water is stored in the Mississippi River Basin at a particular instant in time, but it can certainly be used to see how the water storage changes in that area over a month, a season, or a year. Such information can be extremely useful for water resource managers. |
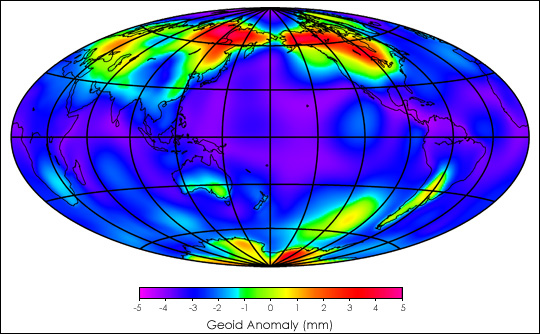
The Earth’s gravity signal changes day-to-day, even minute by minute. The image above shows how the average variability in Earth’s gravity field in August 2002 compared to the average variability during 2001. The red and pink areas show where the variation measured in August 2002 is the most different from the variation measured for the year 2001, while the blue and purple areas show where the variation measured in August 2002 is just about the same as the variation measured for the year 2001. The variability has to be accounted for using models in order to produce a mean gravity field that is useful for hydrologic applications. (Image credit: Paul Thompson / UT-CSR) | ||