The Earth Observatory has published its last Image of the Day on this website. Please join us on our new home at science.nasa.gov/earth/earth-observatory.
Enhanced Vegetation Index (EVI) | |||
In December 1999, NASA launched the Terra spacecraft, the flagship in the agency’s Earth Observing System (EOS) program. Aboard Terra flies a sensor called the Moderate-resolution Imaging Spectroradiometer, or MODIS, that greatly improves scientists’ ability to measure plant growth on a global scale. Briefly, MODIS provides much higher spatial resolution (up to 250-meter resolution), while also matching AVHRR’s almost-daily global cover and exceeding its spectral resolution. In other words, MODIS will provide images over a given pixel of land just as often as AVHRR, but in much finer detail and with measurements in a greater number of wavelengths using detectors that were specifically designed for measurements of land surface dynamics. Consequently, the MODIS Science Team is preparing a new data product–called the Enhanced Vegetation Index (EVI)–that will improve upon the quality of the NDVI product. The EVI will take full advantage of MODIS’ new, state-of-the-art measurement capabilities. While the EVI is calculated similarly to NDVI, it corrects for some distortions in the reflected light caused by the particles in the air as well as the ground cover below the vegetation. The EVI data product also does not become saturated as easily as the NDVI when viewing rainforests and other areas of the Earth with large amounts of chlorophyll. Frequency of Coverage
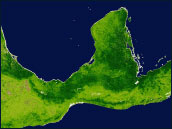
Longer term averages of vegetation data help remove errors caused by clouds, but removes detail, especially at high spatial resolutions. The above pair of images shows the island of Borneo during September 1999. On the left is a 10-day average from September 21–30. Heavy cloud cover caused some areas to appear as if they had little or no vegetation (light brown). The 30-day average for the whole month of September, however, shows that the entire island is heavily forested. With the imaging data the MODIS and AVHRR instruments provide, scientists should be able to use these indices to get daily measurements of vegetation density over most of the Earth’s surface. The maps are helpful in monitoring and understanding environmental and climate changes such as deforestation and desertification as well as drought. The maps also play a major role in other types of satellite measurements. For example, they are crucial in helping scientists classify different types of vegetation over the world’s landscapes as well as detecting changes in land surface cover over time. |
 Measuring Vegetation (NDVI & EVI)
| ||