

Nestled in a low spot within a huge basin in west-central Africa is an isolated blue dot: That’s Lake Chad. Its water sustains people, animals, fishing, irrigation, and economic activity in Chad, Cameroon, Nigeria, and Niger.
But in the past half century, Lake Chad has lost most of its water. The once-great lake now spans less than a tenth of the area it covered in the 1960s. Scientists and resource managers are concerned about the dramatic loss of fresh water that is the lifeblood of more than 30 million people.
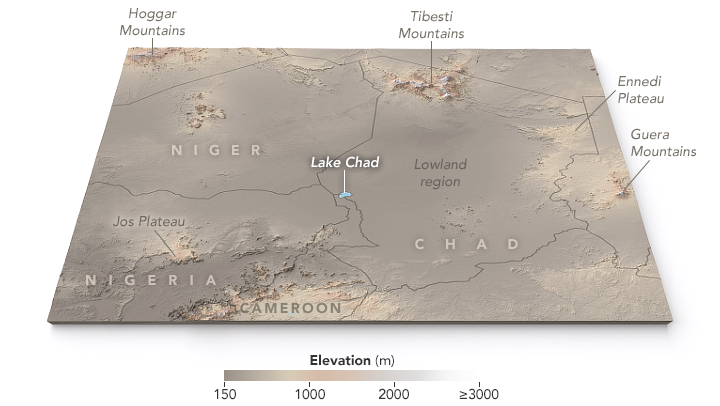
NASA Earth Observatory map by Joshua Stevens, using ASTER Global Digital Elevation Model (GDM2) terrain data.
Lake Chad sits within the Sahel, a semiarid strip of land dividing the Sahara Desert from the humid savannas of equatorial Africa. The Chad Basin spans more than 2.4 million square kilometers, and is bordered by mountain ranges. The water level is largely controlled by the inflow from rivers, notably the Chari River from the south and, seasonally, the Komodugu-Yobe from the northwest. Rainfall can also reach the lake by way of smaller tributaries and groundwater discharge.
Inflow fluctuates with the shifting patterns of rainfall associated with the West African Monsoon, making the system very sensitive to drought. Most precipitation in the Sahel falls during the peak of a short rainy season from July through September. The dry season is most intense between November and March. Years with little precipitation can wreak havoc on the water supply.
Extreme swings in Lake Chad’s water levels are not new. The lake has experienced wet and dry periods for thousands of years, according to paleoclimate research. More recently, variations in depth and extent were noted by French explorer Jean Tilho, who reported in 1910 that parts of the lake had dried up. But what is new is the way researchers are studying changes in the lake. The most recent decline has coincided with development of modern observations from space.
The following images highlight some of the major turning points in the recent life of Lake Chad.
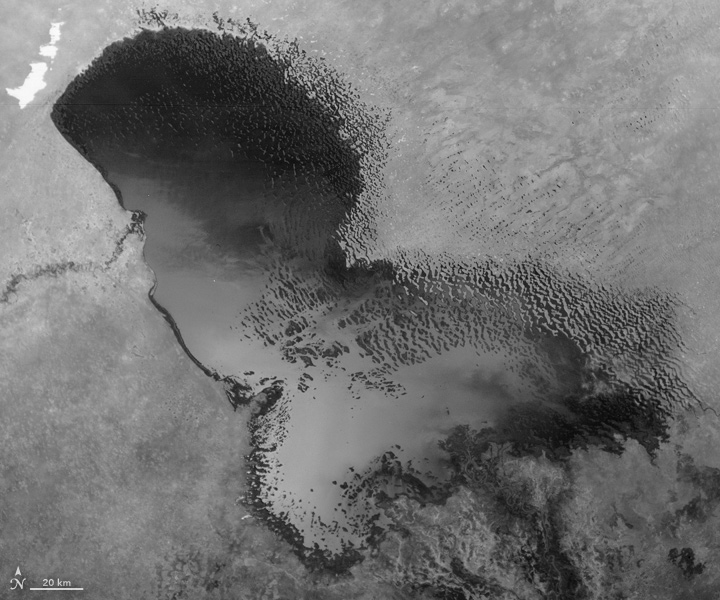
NASA Earth Observatory image by Jesse Allen, using declassified Corona data provided by the U.S. Geological Survey.
The photographs above and below show some of the earliest space-based views of Lake Chad. The first was acquired in 1963 with a camera onboard a reconnaissance satellite from the Corona program. The second was captured in October 1968 by an astronaut on NASA’s Apollo 7 mission. Both images show Lake Chad as one large body of water that had clearly been replenished since Tilho’s survey in the early 20th Century. When these photographs were captured, Lake Chad spanned at least 22,000 square kilometers (8,500 square miles), about the same size as the state of New Jersey.
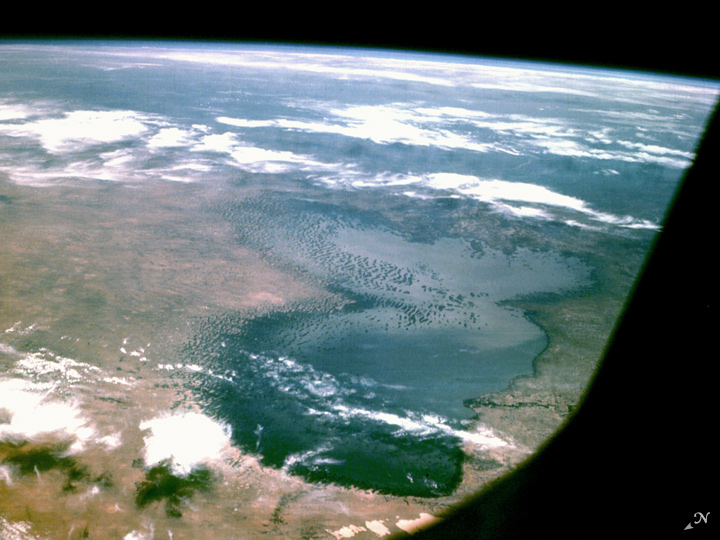
Astronaut photograph AS07-8-1932 was acquired during the October 1968 Apollo 7 mission, and is provided by the Earth Science and Remote Sensing Unit, NASA JSC.
By the 1970s, change was underway. For more than a decade, severe droughts plagued the African Sahel. The resulting reduction to Lake Chad is visible in this triptych of images captured by Landsat satellites. The images are false-color to better differentiate between vegetation (red) and water (blue and gray).
The images show the lake in 1973, 1976, and 1979, a time of great transition and decline in the lake extent. But drought did not affect all lake areas equally.
Around 1973, the lake was in a phase called “Normal Lake Chad”—a single body of water with an archipelago on the north side of the southern basin. Notice how there is little vegetation around the lake at this stage.

NASA Earth Observatory images by Jesse Allen, using Landsat 1, 2, and 3 Multispectral Scanner (MSS) data provided by the U.S. Geological Survey.
By 1976, the lake had transitioned to “Small Lake Chad.” It had separated into two areas: the northern basin and the southern basin, divided by a shallow sill called the Great Barrier. In years when there was not enough inflow to spill over the barrier, the northern lobe stayed relatively dry. Notice, too, the increases in vegetation as permanent or seasonal marshes became the norm.
Throughout the 1970s, water disappeared from the northern basin. Since then, water has come and gone from the northern lobe depending on the year and season. But the two lobes have never reconnected into a single lake.
The downturn continues to capture the attention of scientists and water managers. Doctoral research by Churchill Okonkwo (while he was at Howard University) shows that the late 1960s through the early 1970s marked a turning point in the response of Sahel rainfall to two of Earth’s climate cycles—the Atlantic Multi-decadal Oscillation (AMO) and the El Niño Southern Oscillation (ENSO). These large-scale changes in atmospheric circulation affect precipitation in the Sahel.
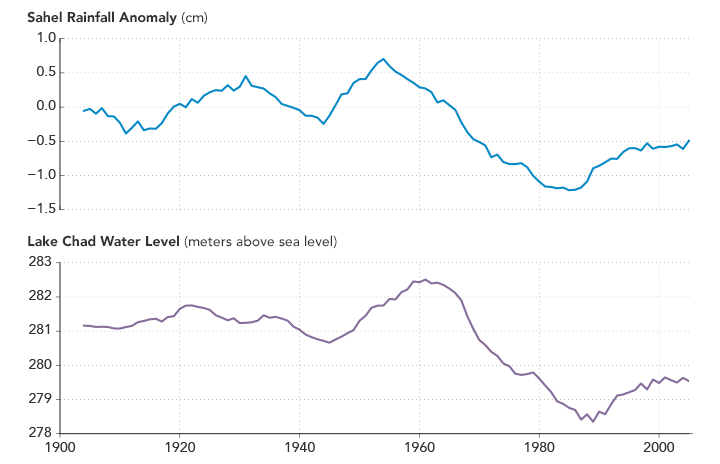
NASA Earth Observatory charts by Joshua Stevens, using data provided by Churchill Okonkwo.
Okonkwo and colleagues showed that in the early 1970s, the AMO was in its so-called “cold phase,” meaning that oceanic and atmospheric circulation patterns shifted in such a way that the Sahel received less rain. The researchers also found that the effect was strong enough to override short-lived, mild recoveries in lake levels during La Niña phases of ENSO, which typically bring wetter conditions. A transition to a strong El Niño in 1982–1983 only added to the dryness.
The chart above shows the water levels of Lake Chad, as calculated from a combination of ground-based gauges and from altimeters on the TOPEX/Poseidon satellite. Since 1900, bumps and dips are evident in the lake level; those changes have mirrored fluctuations in rainfall. But the drop between the early 1960s and the mid-1980s saw lake levels plunge 3 meters below the mean level from 1900 to 2010.
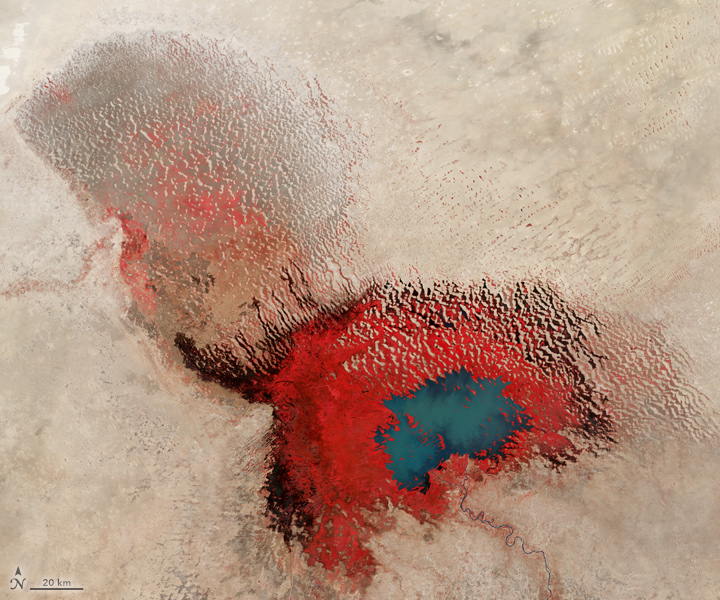
NASA Earth Observatory image by Jesse Allen, using Landsat 5 Thematic Mapper data provided by the U.S. Geological Survey.
By the 1980s, the lake area reached a low of just 300 square kilometers (down from 22,000). This image, captured in January 1987 by the Thematic Mapper on Landsat 5, shows the northern lobe drying out completely. Scientists proposed a new name for this driest phase of Lake Chad: “Dry Small Lake Chad.“ In this phase, the northern lobe stays dry for the entire year—a phenomenon that happened several times in the 1980s. The northern lobe was completely dry for at least a few months almost every year from the mid 1970s to late 1990s.
By 1999, some water filled northern Lake Chad year-round again. Okonkwo and colleagues think a transition of the AMO from a cold (dry) phase to a warmer (wet) phase has played a role. But the recovery has been slow, and lake levels are still below the 1900–2010 mean and far below levels of the 1960s.
The images below show the lake during this period of mild recovery. The first is a photograph taken from the International Space Station in February 2015. The second, false-color image shows the lake as observed in March 2017 by the Operational Land Imager (OLI) on Landsat 8. Notice how it is hard to discern the difference between water and vegetation in the photo, while the infrared bands of Landsat make it easier.
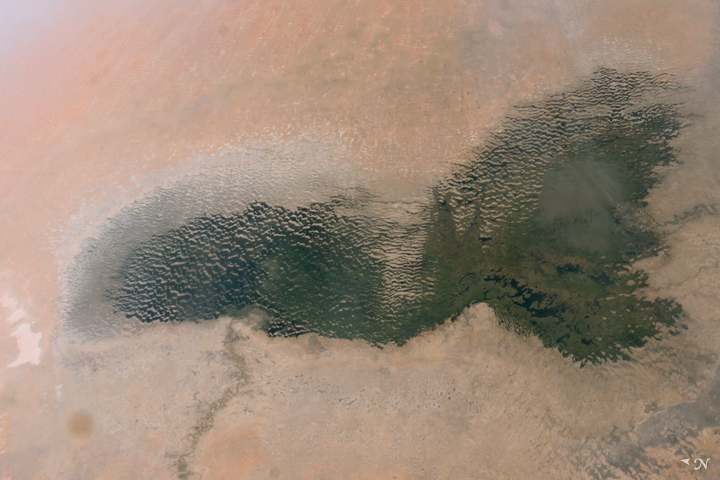
Astronaut photograph ISS042-E-244403 is provided by the ISS Crew Earth Observations Facility and the Earth Science and Remote Sensing Unit, NASA JSC.
Satellite data are especially crucial since the scientists who are trying to make ground-based measurements—by installing and maintaining weather stations and water gauges—have long faced the additional challenge of terrorism and war.
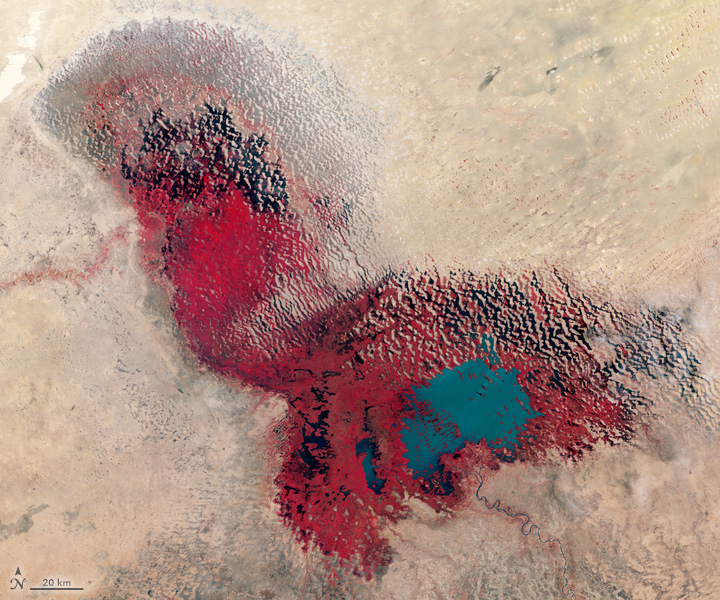
NASA Earth Observatory image by Jesse Allen, using Landsat 8 Operational Land Imager data provided by the U.S. Geological Survey.
“Space-based visible imagery, especially from the Landsat missions and the MODIS instruments, has helped us study and understand the evolution of Lake Chad,” said Teodolina Lopez, a researcher at the International Space Science Institute (Switzerland). “In situ monitoring is difficult due to the current geopolitical context.”
For example, the re-emergence of the Boko Haram insurgency in 2009 has claimed 35,000 lives and caused the displacement of 1.8 million people from northeastern Nigeria, according to the United Nations Development Programme. Kidnappings, bombings, and gun battles have caused havoc in the region.
Charles Ichoku, a senior scientist at NASA’s Goddard Space Flight Center, agrees that satellite data is crucial, given the paucity of ground-based measurements and the difficulty in getting them. Satellite measurements and ground-based data typically work in tandem to paint a complete picture of a region’s water supply.
“The lack of ground-based data is an inherent problem common to many African countries,” Ichoku said. “However, the geopolitical situation is making things worse, as well-intentioned science teams that may want to set up measurements are often deterred by the physical dangers they are likely to face.”
Scientists have made some progress. For example, Lopez has been using remote sensing to examine the role of underground water in the Lake Chad basin. There is evidence that groundwater in aquifers is relatively close to the surface and may be “recharging“ parts of the lake. “It is well known that the Lake Chad water infiltrates the aquifer,” Lopez said. “But we suspect that the minimum water level observed in the southern pool (about 279 meters) is permanent, as it is directly connected to the aquifer.”
While lake levels now appear to be stable, and rainfall is increasing somewhat, the existing data are not enough to say for sure what the future looks like. “Understanding the evolution and changes of Lake Chad,” Lopez said, “is crucial for the countries using its water.”