| TRMMing Off the Tops of Clouds | |||
|
With the help of NASA's Tropical Rainfall Measuring Mission (TRMM) satellite, the trouble with intensity may soon end. "The TRMM satellite is essentially a weather radar put into orbit," says Halverson. Launched in 1997, the satellite orbits the Earth traveling from west to east, back and forth across the equator, taking measurements each day from 40 degrees latitude north of the equator to 40 degrees south. In the Western Hemisphere, this zone extends roughly from the northern border of Virginia to the southern tip of Uruguay.
|
|||
|
While TRMM does have an instrument called a Visible and Infrared Sensor (VIRS) that makes measurements similar to those made by the GOES satellites, it also contains two additional instruments that can see into and through clouds. The first, known as the Precipitation Radar, does exactly what its name implies—it bombards the clouds with radio waves and then receives the signals that bounce back. The radar is rigged so that the only signals that bounce back are from droplets that are at least the size of raindrops. By retrieving data from this instrument, scientists can tell whether a cloud is precipitating or not. The other instrument is known as the TRMM Microwave Imager (TMI). This instrument detects a number of microwave frequencies that the ice crystals and water droplets in clouds absorb and reflect. By precisely measuring these microwave signals, scientists can determine how much ice exists in clouds as well as how warm the ocean water is beneath the clouds (NASA TRMM Web Site, 1996).
Both of these instruments are particularly well suited for measuring the increase or decrease in activity in the hurricane eye wall. The Precipitation Radar can estimate the number of raindrops in the eye wall. A rise in the amount of raindrops is an indication that a hurricane is growing more intense. "In general the more rainwater there is in a hurricane, the more heat is being released into the center of the hurricane, and the more likely the hurricane will grow in intensity," says Halverson. Microwave Imager readings, on the other hand, can give forecasters an idea as to how much ice has formed in the upper regions of the storm clouds. A large increase in ice in the upper levels of a hurricane indicates that the clouds are growing so large and powerful that they have extended high into the atmosphere where the temperatures are well below freezing. Although scientists already have access to TRMM data of hurricanes as they occur, simply glancing at computer images of precipitation and ice formation can only lead to a rough approximation of whether the hurricane is intensifying. "Eventually, we'd like to have a [computer] model that will take the TRMM data and crank out numbers on the amount of heat forming in the eye wall," says Halverson. He and a team of scientists from NOAA and NASA are developing a theory on hurricane intensification using both TRMM satellite data and data from NOAA's orbiting Advanced Microwave Sounding Unit (AMSU), which can measure the temperature of the atmosphere through cloud cover. The hypothesis they are testing will take in TRMM precipitation and ice data from a hurricane, put these data through a number of complex calculations, and return readings on the rate at which heat is being produced in the eye wall. The heat readings would then be related to the existing temperature readings inside the eye from the AMSU data. "If we know how much heat is being released and we can say how warm it is now, we should be able to tell if the eye is heating up or cooling down," says Halverson. If the heat is increasing rapidly, for instance, a convective burst could be the culprit. Already, Halverson's team is testing their hypothesis using TRMM data from Opal, Bonnie, and Paka. They have also been taking airplanes into hurricanes to understand better the finer points of hurricane convection. Halverson says they may be able to track and even predict the heat levels in a hurricane's eye in a few years. |
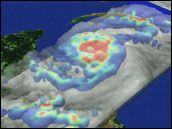 This view of Hurricane Mitch was produced using data from TRMM's precipitation radar. High rates of rainfall appear in red, with lesser amounts appearing in blue. By mapping the structure of storms, experts can "take them apart" in the laboratory as they try to understand how they work. view animation (2.9MB) Animation courtesy NASA Goddard Space Flight Center Scientific Visualization Studio | ||
alert message
