
Hurdles and Milestones | |||
Brakenridge’s success with the study of the Great Mississippi Flood in 1993 paved the way in 1995 for a NASA grant to study “extreme hydrological events” with remote-sensing data. Brakenridge says that before this activity there were only a few ad hoc, commercial flood-hazard applications. The Dartmouth Flood Observatory, as he named the project, was the first providing a global perspective. In the early stages, says Brakenridge, “The project was a preservation activity—just like when you go into towns and you see where people have put signs of high water marks on stream gauges and buildings to preserve the flood history—but we were using satellite data, whatever we could get our hands on.” |
|||
 | |||
Knowing what to do with the satellite data once he had it was another matter. “When the current generation of Earth-observing satellites was being planned, people pretty much assumed that runoff from rivers and streams was just too small to be observed from satellite,” explains Brakenridge. “Everyone just assumed that was one part of Earth’s cycles that we would have to understand through models.” In the absence of specific sensors and technologies intended for flood mapping, Brakenridge and his team—usually no more than a graduate assistant or two—have been pioneers, evaluating available satellite resources and tinkering with the kinds of imagery that they could make from each. During the life of the project, they have raided the immense storehouse of information at several of NASA’s specialized data centers: Earth Sciences at Goddard Space Flight Center, Land Processes in South Dakota, and Snow and Ice in Boulder, Colorado. They have used satellite observations from a host of NASA and National Oceanic and Atmospheric Administration (NOAA) satellites, including the original efforts with the European Remote Sensing satellite, Landsat, QuikSCAT, Terra, Aqua, and the NOAA-NASA Pathfinder. “When I think about the work I’m able to do, it is really amazing. All scientists get to use special instruments, lab or field instruments, for example. But NASA has these instruments in space that cost hundreds of millions of dollars, and we get to use them! Sometimes we can have one of them turned on for us,” he says, as though even after all this time, he can’t believe his good luck. “NASA has really been leading the way [in Earth observation], especially with their open data policy. It’s really exciting, taking these systems that haven’t really been designed for us and having the access to the data and the opportunity to figure out how they can help us.” |
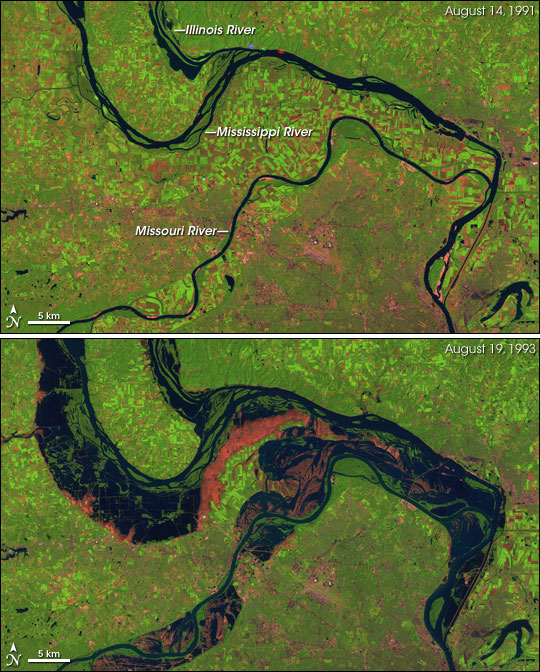
Scientists at the Dartmouth Flood Observatory use data from many satellites to map historical floods. These images show the confluence of the Mississippi, Illinois, and Missouri Rivers just upstream of St. Louis. The upper image shows the rivers in normal summer conditions (August 1991), while the lower image shows the rivers at the end of the great floods of 1993 (August 1993). (Image by Jesse Allen, based on data provided by the Landsat Science Team) | ||