
The Landscape of History | |||
Steyaert based the modern land cover map on satellite data collected in the early 1990s by the Thematic Mapper sensor on NASA’s Landsat 5 satellite. As a first step, Steyaert used the USGS National Land Cover Dataset developed from 1992-93 Landsat scenes. To get additional detail on the types of wetlands, he added land cover data based on Landsat scenes from 1993-94, which were produced by the “Florida GAP” project. |
|||
 | |||
The ability of satellites to map large areas at once was a benefit sorely missing from historical descriptions of Florida land cover. To get a complete map of the pre-1900 natural vegetation for the area the team wanted to study, Steyaert had to pull together information from books, natural vegetation maps, and papers published as far back as 1943 that he could use in a Geographic Information System (GIS) analysis. Even with all those sources of information, the picture still wasn’t complete. Critical details about the different types and sizes of historical wetlands came from Deb Willard, a paleobotanist who had been “collecting the dirt” on southern Florida since the mid-1990s. She started working in the area after continuing agricultural and urban pollution, disrupted water cycles, and other ecological problems motivated Congress to pass the Comprehensive Everglades Restoration Act, a thirty-year, multi-billion-dollar project to restore the “River of Grass” to a more natural condition. |
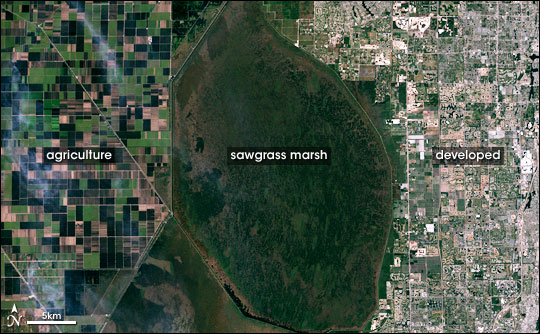
Landsat images clearly show different types of landcover in southern Florida. (NASA image by Robert Simmon, based on Landsat 7 data provided by the UMD Global Land Cover Facility) | ||

Willard is working to figure out what the “natural condition” would be—what types and amount of vegetation would exist, how deep the water would be, and how the level would vary at different times of the year. She collects cores of soil from locations all over the Everglades, from bogs, to lakes, to tree islands. The pollen trapped in the layers of soil reveal what plants and trees were around hundreds, even thousands, of years ago. |
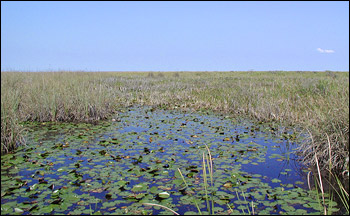
Beneath the open water sloughs and sawgrass marshes of the Everglades, a thick layer of peat preserves a record of past vegetation—ancient pollen grains. (Photograph courtesy Deb Willard, USGS)) | ||
 | |||
The Everglades haven’t been in a natural state for a long time, says Willard, with efforts to drain them beginning in the late 1800s. Current conditions are unlike anything else in the past 3,000 to 4,000 years. There is much more pollen of sawgrass and weedy plants because it’s drier, and there are vast areas of cattails that never existed in the past. Tree islands that had built up over hundreds of years on isolated pockets of higher ground were allowed to remain flooded for more than a decade, and many died within a few years. Willard’s pollen work filled in crucial details about the distribution of different kinds of wetlands during the Everglades’ past. |
Microscopic pollen grains retrieved from the Everglades act as a fingerprint for past ecosystems. (Micrographs courtesy Deb Willard, USGS) | ||
 |
Speaking RAMS languageGetting the land cover maps completed was only the first hurdle. A model needs more information than “Over here there used to be a freshwater marsh, and over there was a cypress swamp forest.” What’s equally important to the model is how each of those surfaces responds to solar heating and interacts with the atmosphere. In describing how the RAMS model works, Marshall says, “In Nature’s daily cycle, the Sun comes up in the morning and begins heating the Earth. The incoming energy gets partitioned basically one of three ways: some evaporates water, some heats the land surface (which then heats the air), and some is conducted downward into the soil. Mostly, it’s land cover that determines which of those things happens.” RAMS performs all the mathematical calculations to determine the net result of all the different energy-balance characteristics of all the different land cover types, and then predicts what the effect on the weather would be. The main things that determine how the energy gets split up at the surface are the vegetation (what type and its biological and physical characteristics), soil (what kind and how moist), and water (how deep). These characteristics are known as a surface’s biophysical parameters. Steyaert used the default biophysical parameters for RAMS 20 standard land cover classes as the basis for the 40 land cover categories in their maps. Most of the new categories were different kinds of wetlands, so Steyaert added in estimates of the seasonal depth and duration of standing water, which is called the hydroperiod. Developing the land cover maps, the biophysical profiles, and the hydroperiod information for use in the RAMS simulations occupied Steyaert for the better part of a year. |
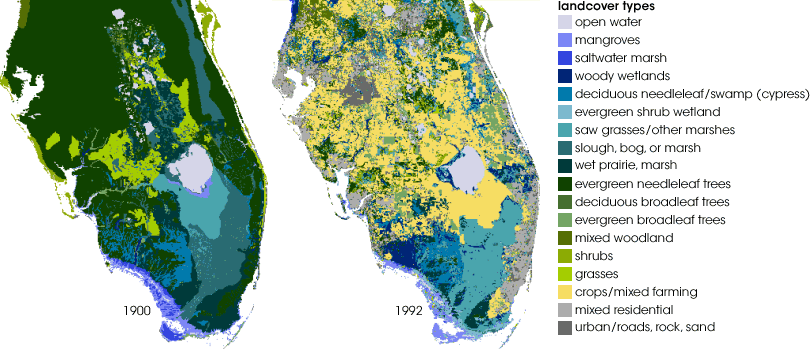
Human influence has transformed southern Florida. The transformation occurred not only on land converted to cropland or cities, but even in protected and undeveloped areas like the Everglades. Changes in water flows transformed deep-water sloughs into drier sawgrass marshes, and mangrove forests have shrunk dramatically. (Maps adapted from data provided by Lou Steyaert, USGS and NASA GSFC) |