The Earth Observatory has published its last Image of the Day on this website. Please join us on our new home at science.nasa.gov/earth/earth-observatory.
Keeping an Eye on the World’s Coral |
|||
Andrefouet says at the very least this high-resolution map would provide an accurate resource for anyone wanting to study or monitor reefs. The ultimate goal of the NASA and USF scientists is to use this map to assess the health of the world’s reefs on a number of different levels. On a global scale, such a map would provide scientists with a way to monitor large-scale potential threats to the reefs. The reef map, for instance, could be compared to worldwide sea surface temperature maps to determine which reefs are most likely to be bleached by global warming. Maps demarcating pollution from coastal run-off areas could alert researchers as to which reefs were in danger of being inundated with pollution. "With existing data, it is possible to observe these phenomena almost on a day-to-day basis," says Andrefouet. "It also provides a baseline to prioritize acquisition of very high resolution (few meters) images, such as those provided by IKONOS and the future hyperspectral Orbview-4 commercial satellites, as well as for optimized sensors operated by NASA on the International Space Station." The satellite map could also be employed to observe long-term trends in reef mortality. After a section of reef has been dead for a number of years, the reef’s underlying structure will begin to disintegrate. "Over a period of time the compact platforms undergo a shift to platforms with holes and breaks," says Andrefouet. The Landsat 7 can pick up on these changes in the reef's structure. By constantly keeping updated images of the reefs over the decades, scientists could develop an archive of images that would allow them to see if any of these reef deaths are part of a larger, natural cycle. They could then compare these present day trends to fossil cores taken from ancient coral reefs (known as paleorecords) to see if similar changes have occurred before in the Earth’s history. |
|
||
|
|||
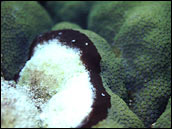
Unfortunately, Andrefouet says that given the current level of technology
researchers cannot discern if a reef is dying or has just died using remote sensing data alone. The
instruments on Landsat 7, or for that matter any commercial satellite, simply are not powerful enough to
observe if a reef has recently lost its thin layer of polyps. Usually the change is subtle since the
algae that typically covers a reef en masse soon after the polyps die creates the illusion of a healthy
reef in a satellite image. As reefs can die in a matter of months, networks of volunteers will still
have to assess the immediate health of reefs they believe to be in danger. Andrefouet points out,
however, that remote sensing maps aid in these rapid assessments. |
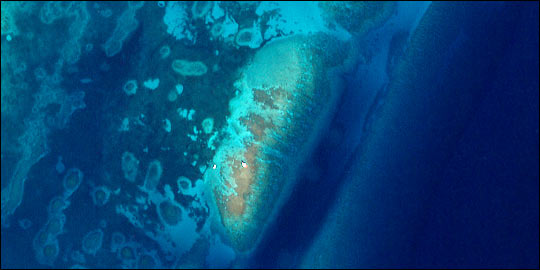
This true-color image of Carysfort Coral Reef, Florida was taken by the IKONOS satellite. Owned and operated by Space Imaging, the satellite collects data in some of the same wavelengths as Landsat 7, but at a higher resolution. (Image courtesy Serge Andrefouet, University of South Florida. Contains material copyright Space Imaging L.P.) | ||
There are several efforts underway to develop techniques that will employ remote
sensing to further identify reefs in immediate danger. Phil Dustan has been working with Andrefouet and
Dave Palandro, a graduate student at USF, on just such a technique using Landsat 7 data. "By looking at
the variability of the pixels’ brightness on a set of images, we can map how much change that reef has
undergone," says Dustan. In the change from a polyp-covered reef to an algae-covered reef, there is a
slight fluctuation in the reef’s color. He explains that while this may be too subtle to see outright on
a satellite image, scientists may be able to identify the transformation by simply mapping out the
variation in the brightness of the individual pixels in a satellite image over several months. The end
product would resemble a three-dimensional relief of the reef with any peaks showing areas with the most
variation in brightness and the flat sections depicting the areas with the least variation. This relief
could then be set over a land cover classification map to see which areas of the reef fluctuated in
color the most and are consequently in the most trouble. |
|||
Dustan explains that he’s used this technique on reefs on the Carysfort Reef in Florida, which was once one of Florida’s most vibrant reefs, replete with platforms of Elkhorn coral. The reef died over the course of the last five years. During the time it was dying, Dustan collected Landsat 7 and other satellite remote-sensing images of the reef even as he assessed the health of the reef firsthand underwater. Dustan along with the USF group constructed variable brightness maps of the region using the satellite data and overlaid them on an aerial map of the coral reef. Just as they suspected, the areas of reef that died showed up on the three-dimensional variable maps as tall peaks. The areas of reef that stayed the same were nearly flat. Though the technique is in its early stages of development, Dustan feels that these variability maps could aid in a worldwide assessment of reefs. Once the scientists develop a comprehensive high-resolution map of the world’s reefs using Landsat 7, they could then use the same data to create the relief maps. The two could be placed on top of one another to pinpoint those reefs that are in the most danger of collapsing. Of course, the best plan would be to put programs in place that stop us from destroying our reefs altogether. Sewage and water treatment systems need to be constructed in urbanized areas near coral reefs, dynamite fishing should be outlawed, and fishermen must realize what over fishing does to the reefs. "What we need to put in place is a list for cleaning up the oceans. Only then will coral reefs begin to recover," says Dustan. References 1. Dustan, P., 1999: Testimony Presentation on Coral Reef Conservation Issues at the Senate Subcommittee Hearing on Oceans and Fisheries. Washington, DC. 2. Miller, S. L., and M. P. Crosby, 1998: The Extent and Condition of US Coral Reefs. NOAA's State of the Coast Report, National Oceanic and Atmospheric Administration (NOAA), Silver Spring, MD. 3. Bryant, D., L. Burke, J. McManus, and M. Spalding, 1998:Reefs at Risk: A Map-Based Indicator of Threats to the World’s Coral Reefs. World Resources Institute, Washington, DC. 4. Pockley, P., 2000: Global Warming Identified as Main Threat to Coral Reefs.Nature,407 (6807), 932. |
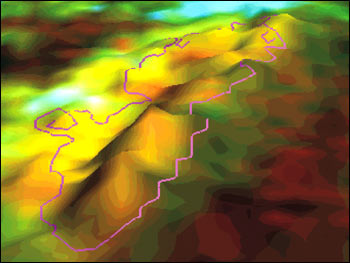
This image of Carysfort Reef combines a snapshot of the reef (color) with the variability of the reef over time (height). The area of the reef is outlined. Researchers built this map by comparing the color of individual pixels representing a 30 by 30 meter area of the reef from 15 years of data. Increasing variability (height in this image) corresponds to a decrease in live coral cover accross time and highlights the shift from a healthy coral ecosystem to a rubble-algae dominated system. (Image courtesy Phillip Dustan, College of Charleston) |
||