It’s a Jungle out There |
|||
This perfect opportunity wasn’t going to just fall out of the sky, though. It would require tremendous creativity, ingenuity, and sweat from Nepstad and the local carpenters, self-educated engineers, and laborers he hired to help figure out how to exclude rainfall from a 100-meter-by-100-meter (1 hectare) plot of rainforest. |
|||
It might seem easier to just go out and find a location that was experiencing a naturally occurring drought and then compare it to a location that wasn’t. The trouble with that idea is that the plots need to be similar to each either other in as many ways as possible—from the number and kinds of trees, to topography and altitude, to soil type—so that the scientists could be sure any differences between them were due only to drought stress. In a place as diverse as the Amazon, that kind of similarity is rare. Once you found two such places, you might have to observe the two for years—perhaps a lifetime—in the hope that at some point, one would experience a drought and the other wouldn’t. “If you look at all the trees in a 1-hectare plot with a minimum diameter of say, 10 centimeters, at least 2/3 of those trees will be a single individual of a species. That’s how diverse the place is. Just to find two 1-hectare plots that had several species in common, we had to survey 22 hectares,” explains Nepstad. |
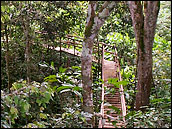 Hand-crafted wooden walkways gave scientists access to the upper levels of the forest where they could measure the effects of drought on the rainforest canopy. (Photograph courtesy Paul Lefebvre) | ||
Then the sites faced another test. “The first big challenge at any potential site,” he continues, “was whether we would be able to dig a 10-meter pit in the ground so that we could measure soil moisture at various depths. I had to carry along an auger to test-drill at potential locations.” There was no guarantee that the ground would be suitable for digging. Almost the entire Amazon Basin was once covered with a vast lake, and the region’s soils are dense clay formed from sediments that settled to the bottom over hundreds of thousands of years. Asner laughs as he says he is glad his part of the project didn’t involve much digging. “In the wet season, the soil turns to a thick clinging mud that sticks to shovels and boots and everything. In the dry season, it turns to brick.” Asner faced challenges of his own, though. The biggest problem with remote sensing in the Amazon is the clouds. “Even if imagery is mostly clear,” says Asner, “it seems like there will always be a cloud in the area you want [to see]. At some locations you might get only one or two cloud-free observations per year, which isn’t much, but it turns out to be sufficient for land use change and selective logging studies. It works pretty well for drought stress, too, because the one to two cloud-free overpasses are in mid to late dry season, which is the most drought-stressed time of the year for the forests.” |
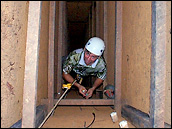 A researcher descends into a 10-meter-deep pit to measure soil moisture. Normally, rainforest trees survive months of seasonal drought each year by drawing on water stored deep in the soil. During severe droughts, however, the soil can become so dry that even deeply rooted trees suffer. (Photograph courtesy Dan Nepstad) | ||
 | |||
In with the NewThe satellite observations for the study came from NASA’s first satellite-based hyperspectral remote sensor. The difference between a hyperspectral sensor and a multispectral sensor is that a multispectral sensor detects electromagnetic energy in a sampling of broad slices (groups of wavelengths) of the spectrum while a hyperspectral sensor detects hundreds of very narrow slices of the spectrum that are contiguous, meaning that one slice touches the next, leaving no gaps. Called Hyperion, the hyperspectral sensor is flying on the Earth Observing-1 satellite. Hyperion is one of several new sensors that NASA is testing in an effort to produce smaller, less expensive devices with more capabilities than its current generation of sensors. The current Landsat satellites, for example, whose observations have been the centerpiece of high-resolution land cover and land cover change mapping for years, only collect observations of 7 different spectral bands (the broad slices of wavelengths of electromagnetic energy described above) reflected or emitted from Earth. Hyperion detects 220. If a multispectral sensor can be compared to you standing at a paint counter in a home improvement store asking for white paint, a hyperspectral sensor would be the clerk asking, “Did you want antique white, or colonial white, or off-white, or eggshell white, or ...?” |
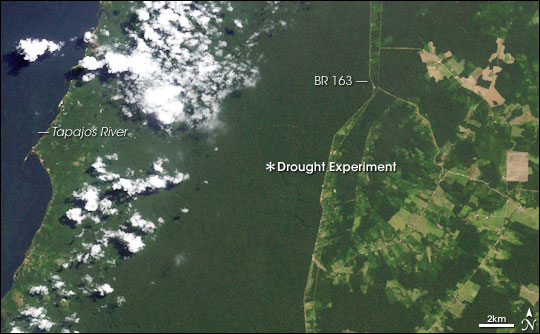
About 50 kilometers south of where the Tapajós River joins the Amazon River, the Tapajós National Forest lies between the Tapajós River in the west and the Santarém-Cuiabá Highway (BR-163) in the east. Large, rectangular clearings punctuate the forest beyond the highway. The Tapajós National Forest is a 6,000-square-kilometer protected area where international teams of scientists carry out research into how the Amazon responds to human and natural disturbances. (NASA image by Robert Simmon, based on data Landsat 7 data provided by the Global Land Cover Facility) | ||
 |
 | ||
With all those wavelengths to choose from, Asner had a much better chance of detecting the changes in pigment activity, leaf area, and carbon balance that he suspected would change when the forest got stressed by drought. “The problem with remote sensing of vegetation conditions in the Amazon—well, aside from the clouds—is how lush everything is,” says Asner. Most satellite-based indicators of vegetation describe vegetation “greenness,” which is a general characteristic of vegetation that results from leaf area, canopy cover, and architecture. Greenness indicators are based on the relative amounts of visible light and infrared light being reflected from the forest. Chlorophyll and other pigments in the plant leaves absorb visible wavelengths (except green), while the chemicals that make up the leaves’ cell structure reflect near-infrared light. The trouble is that because it is so green in the tropical rainforest, the signal can get “saturated,” which means that above a certain level of greenness, it all looks the same to the satellite. Asner decided to test the traditional vegetation indicators against some that used the new information provided by Hyperion to see which ones did the best job of detecting the changes in vegetation brought about by Nepstad’s simulated drought. In addition to two traditional greenness indicators, he tested three new indicators that could only be made from hyperspectral observations: one that was sensitive to the amount of a chlorophyll-helper pigment called xanthophyll, one that was sensitive to a pigment called anthocyanin, and one that was sensitive to the water content in the leaves of the forest canopy. |
A hyperspectral sensor like Hyperion observes energy in a series of adjacent, narrow slices of the electromagnetic spectrum. Plotted on this graph, Hyperion’s observations appear as a continuous black line. Multispectral sensors like Landsat detect a single, average value (red dot) for a block of wavelengths (pink rectangles). For wavelengths near 800 nanometers, for example, Hyperion detects several peaks and valleys in the energy reflected from a surface, while Landsat records a single measurement. (Graph by Robert Simmon, based on data provided by the EO-1 science team) | ||
