
Ground-based weather radars are a critical component of the OLYMPEX project on the Olympic Peninsula. Situated near the coast, NASA’s NPOL radar records precipitation data over the ocean and toward the mountains. As with any scanning weather radar, the beam width and height above ground increases with distance from the radar. Therefore, even though NPOL is scanning toward the mountains, the lower portions of the Quinault Valley are being missed.
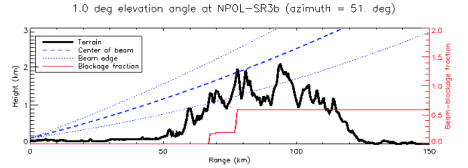
Figure showing the beam spread for a 1-degree elevation angle scan for NPOL. Terrain profile shown in black. Red line shows the percentage of the beam blocked by the terrain.
To fill in this low-level gap in data, a Doppler on Wheels (DOW) weather radar (funded through the National Science Foundation) is deployed at Lake Quinault. This mobile radar is commonly known for tracking tornadoes across the plains of the U.S., but for OLYMPEX, the radar is sitting still in a yard and scanning up the valley toward the mountains.
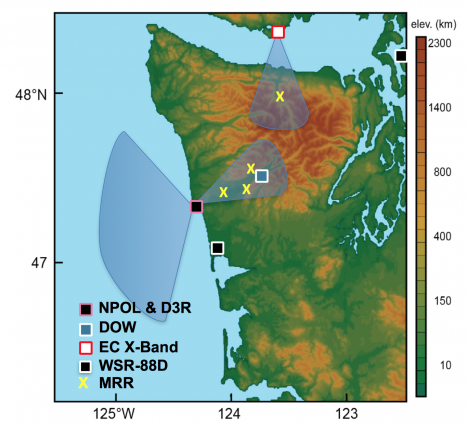
The OLYMPEX radar network showing the NPOL scanning region and the DOW location in the Quinault Valley. Environment Canada is also operating a weather for the project, scanning the northern side of the peninsula from Vancouver Island.
Inside the truck, surrounded by transmitters, antenna controls, and computers, the scientist on duty monitors the real-time data being collected, taking notes on interesting observations and making sure the quality of data is adequate. We also monitor internal and external data storage (the data is saved in several locations), make sure the radar is scanning the correct sequence, and check on other radar data to see the bigger picture beyond the valley.
Here is an example of the type of data we can collect with the DOW. These images show several of the dual-polarization radar variables from a vertical slice through a precipitating storm toward the mountains. Reflectivity is the intensity that you typically associate with radar data seen on TV. In this case, weak intensities are generally observed due to the widespread light rain of this system. The higher intensity line near 2 km height is called a “brightband” and represents where the snow above is melting to form rain below. We monitor the intensity and height of this brightband scan-to-scan, storm-to-storm, and a how it changes between the radar and the mountains. The radial velocity is the Doppler portion of the radar, showing airflow towards (blues/greens) and away (reds/oranges) from the radar. In this example, most of the wind is coming from the southwest, flowing up the valley, but there’s a shallow area near the ground of down-valley flow toward the radar. This shallow down-valley flow would likely be missed by the NPOL radar near the coast, highlighting the value in having the DOW located further up the valley. The other variables shown in the bottom portion of this panel also help us understand the precipitation processes, where the brightband is seen clearly as enhanced differential reflectivity and reduced correlation coefficient.
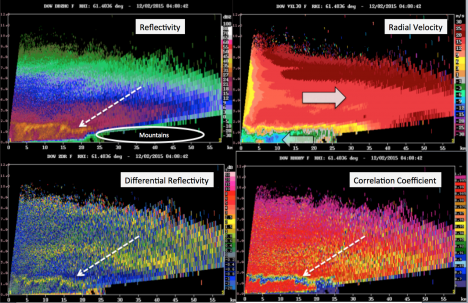
Example of DOW radar data, showing a vertical slice through a precipitating system. Dashed arrows point to the brightband, where snow above is melting to rain below. Block arrows in the velocity image indicate the direction the air is moving.
This intriguing pattern of up- and down-valley flow has varied throughout the project, highlighting the complex influence of the local topography on the storms. We could regularly monitor this pattern on the radar, but at times, could also see the complex flow pattern by eye, as winds changing speed and direction throughout a shallow layer led to mesmerizing cloud patterns such as Kelvin-Helmholtz wave clouds.
Early in the project, a series of storms led to enough rain and snowmelt to almost have to make use of the mobile ability of the DOW. Lake Quinault rapidly rose to 14 ft, spilling into the yard and causing concern for the DOW operations.
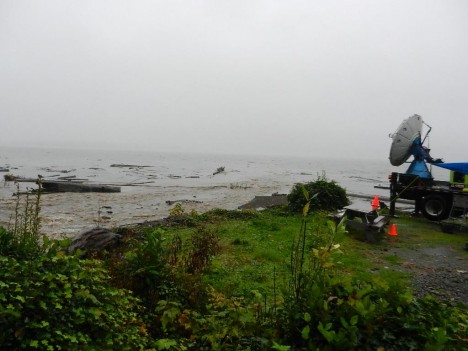
Lake Quinault spills into the DOW yard after a major precipitation event (Photo credit: Hannah Barnes)
Thankfully, the precipitation stopped and the water receded before the DOW had to be moved. After this drenching start to the project, a strong high pressure system cleared the skies and halted DOW operations. The clear, calm skies led to fog formation over the relatively warmer lake, providing a beautiful view at the DOW house.
This rain-free period allowed us to catch up on data analysis. We set up computers in the house where we could access all the data that has been collected thus far, providing us with an opportunity to dig deeper into the fascinating science of these exciting events. Plus, the view from our DOW house office isn’t so bad.
We are so thankful for the wealth of data collected during the first few weeks of the project. And we are so thankful that the atmosphere decided to give us clear skies for Thanksgiving, allowing for the first full down day of the project. This provided many of the local participants at the UW operations center an opportunity to spend time at home with family on this holiday, while those of us at the DOW had the chance to explore the beautiful Quinault Valley.
Known as the Valley of the Rainforest Giants for the record-holding sizes of many tree species, the Quinault Rainforest reminds us of the incredible impact the large amounts of precipitation has on the area. After spending several days staring intently at computer screens, it was refreshing to gaze in wonder at the giant trees, to feel their mossy coats, to smell the fresh air and wet ground, to listen to the river and streams flowing through the valley, and to give thanks for the rain and snow we are studying that allows this beautiful place to exist.
After this welcome break, the rain has thankfully returned. The DOW continues to collect fascinating data in the Quinault Valley and the forests of the valley continue to inspire awe.
Happy (belated) Thanksgiving from the DOW crew.
The western side of the Olympic Mountains is a sight to behold, with crashing waves along the rocky coast and mossy trees in the rain forest signifying the impressive amounts of precipitation that falls in this area. The ongoing Olympic Mountains Experiment (OLYMPEX) is set up to measure rain and snow over the ocean up to the highest mountain peaks using airborne and ground-based instruments. As part of this project, NASA’s ground-based weather radar, NPOL, sits atop a hill on the Quinault Indian Reservation, with clear views out over the ocean and up the Quinault valley toward the snowy mountains.
As a Seattle resident, I, Dr. Angela Rowe, spend a lot of free time exploring the forests of the Olympic Peninsula. As a Research Scientist in the University of Washington’s Department of Atmospheric Sciences, I spend my work day (and honestly a good bit of my free time) using weather radar data to better understand storms around the world. To have the opportunity to combine both of my passions into one project seems too good to be true.
On a drizzly, foggy morning, I pack up my truck with supplies (water, canned soup, a warm blanket) and drive 20 minutes to the radar site. Half of this journey involves ascending a steep road prepared just for this project. It’s a slow-going trip as the creatures of the peninsula (deer, coyotes, rabbits, etc.) could jump out at any moment. It’s also worth driving a little slower to take in the eerily beautiful scene.
I reach the radar to see the site blanketed in cloud. My view may be limited, but the NPOL radar can “see” out to nearly 135 km (> 80 miles).
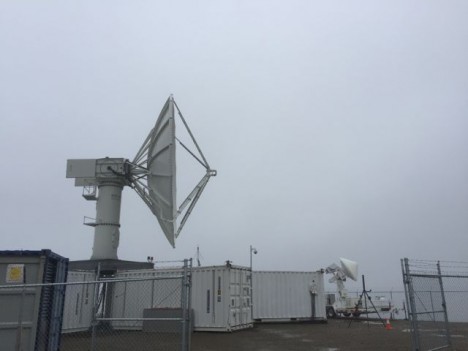
The NASA NPOL and D3R weather radars scan the clouds. NPOL’s frequency is best for looking at precipitation, while the D3R’s dual frequencies are better suited for thin, nonprecipitating clouds than NPOL. (Photo credit: Dr. Angela Rowe, UW)
NPOL sits atop 5 containers, which were used to ship the radar out to the site. One of these containers serves as the “office” for the radar scientists on duty. With 12-hour shifts (the radar operates 24/7), it’s important to find a way to get comfortable in this space, shared with several other scientists.
The NPOL radar scientist occupies the back left corner of the trailer, where we have a laptop set up to record and analyze data. Real-time displays of the data sit to my left so I can keep a watchful eye to make sure all is running smoothly. The radar engineer on duty is nearby in an adjacent trailer, waiting to help if things go awry.
In addition to monitoring and analyzing radar data, the radar scientist on duty is also responsible for helping launch “soundings”. There is an instrument (called a radiosonde) that is attached to a large balloon which is then released into the atmosphere at a specified time. Data is transmitted back via an antenna located near the radar, providing us with vertical profiles of temperature, humidity, pressure, and winds throughout the atmosphere. This is a routine task under most circumstances, but on the stormy days we are studying for OLYMPEX, the wind and rain can add some obstacles. On this day, with over 30 mph winds out of the southwest and heavy rain at the site, it took four of us to launch the sounding, sliding along the muddy ground as the balloon pulled us toward the northeast.
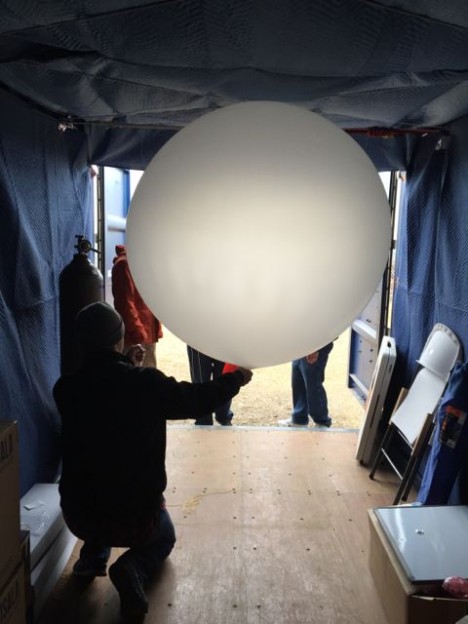
The balloon is inflated with helium in another one of NPOL’s trailers, after which the instrument is attached and we head outside to launch the sounding. (Photo credit: Dr. Angela Rowe, UW)
After a successful launch, high fives seemed appropriate as we went back into the trailer, took off our rain gear, and began to watch the sounding data come in. This information serves as the environmental context for our radar observations. How is the wind profile affecting the storms? How are the storms feeding back on the temperature and moisture levels of the environment? At what level in the atmosphere is the snow turning to rain? Is that level the same across the area? How are the mountains playing a role? These are important questions we are trying to answer at the NPOL/sounding site.
In 3 hours, it’s time to put on our rain gear again (the OLYMPEX version of a scientist’s lab coat) and prepare to launch another balloon. It’s cold, wet, and windy,…and we wouldn’t want it any other way.
At the end of the 12 hours, I head back out into the rain for the final time that day. It appears that I’m not the only one excited about the rainy day, as a northwestern salamander was sitting outside the trailer!
I leave the residents of the NPOL site behind and slowly drive back down the dark, winding road, reflecting on the exciting day and ready to do it all again tomorrow.
By Ludovic Brucker
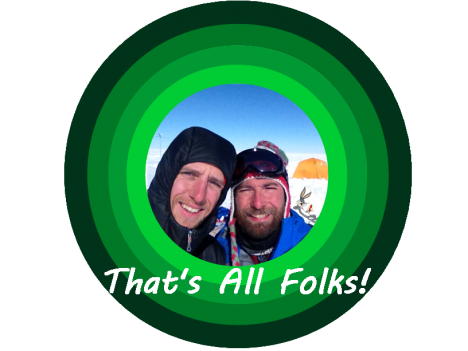
After an unexpected phone call from the helicopter pilot on Easter Sunday, Ludo and Clem ended the second season of the Greenland aquifer campaign, with the support of Susan, Rick, Lora, Bear, the weather office, and many others. Thanks all for this Easter bunny.
We still wonder whether our campaign was successful, or fair. For sure, it was a mix of good and tough times.
The pluses, making our campaign a good time:
– We’re back from our field site, healthy and with all our fingers and toes!
– We set up an almost perfect camp, limiting drift considerably.
– Our two tents survived 65-knot winds!
– We had saucisson (dry cured sausage), and cheese for fondue!
– No polar bear smelled our food!
– We collected over 17 miles (28 kilometers) of high-frequency (400 MHz) radar data, including 12 mi (20 km) in one day (equivalent to half a marathon!)
– Along a 1.24-mi (2-km) segment of the 2011 Arctic Circle Traverse, we deployed 5 radars operating at 400, 200, 40, 10, and 5 MHz.
– We installed an intelligent weather station developed by the group at IMAU, in the Netherlands.
– We drilled down to 28 feet (8.5 meters) to record the density and stratigraphy of the ice layers.
– We have GPS taken positions during a week, which will help us calculate the velocity and flow direction of the ice in this basin.
The minuses, making our campaign “different”:
– Ten days of weather delays before the put-in flight to our ice camp location.
– Rick could not make it to the field with us.
– We never had three consecutive half days with weather suitable for work.
– Getting a sore throat from shouting to hear each other less than a meter apart.
– During the one day of great weather, we tried to drive down a pilot tube to install a piezometer in the aquifer. This technique is adapted for ground water found within rocky soils. It was the first attempt to do it in the Greenland firn. Driving the metal pipes in the snow through the ice layers was a nightmare, we had to pound on those pipes really hard to make them go through the thick ice layers and we ended up breaking them. At one point, we thought it was broken slightly deeper than 6 ft below the surface, so we dug a pit down to fix it. Well, it turned out that the broken piece was actually 13 ft down — we spent the only full day of great weather breaking our equipment.
– We ran out of cheese for fondue, and of saucisson.
– Sunscreen was completely useless this season.
The “funny” stuff:
– 30 m/s wind is brutal, though not necessarily hilarious.
– High-wind speed does not make the clock spin faster, only the anemometer.
– Supporting text messages and jokes from our family, colleagues, and office mates.
– Attempting a radar survey with a sled taking off every other gusts.
– Calling the Met Office for a weather forecast: “Hello! Since it’s windy here we are wondering what will happen in the next 36 hours.” “Yes, I can confirm that you are experiencing wind.” “Thanks so much for the confirmation, but there was no room for doubt.” “Oh, but it’s a nice spike on the computer screen! It won’t blow more, but it won’t stop soon. Be careful out there”. Patience with Mother Nature is the #1 fundamental.
– Coastal storms from the East might be our favorite storms on the ice sheet: wind stops, and temperatures increase, but it snows, snows, and snows.
– Sixteen feet of seasonal snow is deep, especially with the top 2 feet of fresh snow becoming harder and harder as they it gets compacted by the wind.
– Excavating 1765 cubic feet of snow between 8pm and 11:30pm (you got to use the weather window whenever you have it.)
– The frost all around our sleeping-bag head every morning.
– The 40 hours laying down in the sleeping bag.
– The melody of the wind on our tents and through the bamboo sticks we stuck around them.
– Using the sleeping bag to store hats, balaclavas, gloves, socks, boot insulation, contact lenses, tooth paste, sun screen (it was nice to dream about the day we would need it), batteries, head lamp, snacks, water bottles (ideally liquid and not spilling.)
– The pilot phone call at 8 am on Easter Sunday: “Good morning, happy Easter! Don’t go for a ski strip today, we will come pick you up in 3-4 hours!”
This was the synopsis of our 13-day adventure on the ice sheet. Even though we have been pulled out from the ice sheet, we still have some work to do, such as cleaning and drying our cargo and repackaging it for shipping to either Kanger, or the US.
Now, we would like you to enjoy some photos taken in the field. Thanks again for spending some times reading the blog and following us! Until the next campaign, enjoy each season and stay warm! As we say in French: “En Mai, fait ce qu’il te plaît!” In English, it translates to something like: “In May, do as you please!”. Yup, we’re heading back to the office and will hide behind a computer screen for the months to come.
All the best,
Ludo & Clem
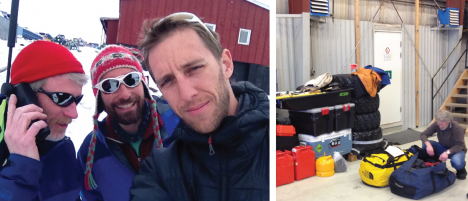
(Left) As weather-delay days continue to keep us in town, Rick calls the weather office to assess whether we can afford to spend more days waiting to be deployed on the ice sheet. (Right) The saddest moment of our campaign, when Rick had to remove his gear from our cargo because he wasn’t coming with us to the field.
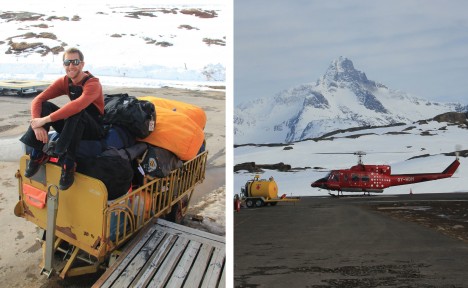
(Left) At the Tasiilaq heliport, Ludo waits for our put-in flight on the cargo. (Right) The Air Greenland B-212 helicopter with blue skies and high clouds. After 12 days of patiently waiting, it looks like it’s a go!
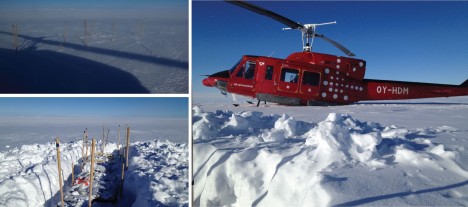
(Left) Our cargo, dropped almost two weeks ago, got buried under 2 feet of snow. But all the pieces were there! (Right) The B-212 landed near our cargo for a final move to the ice camp location.
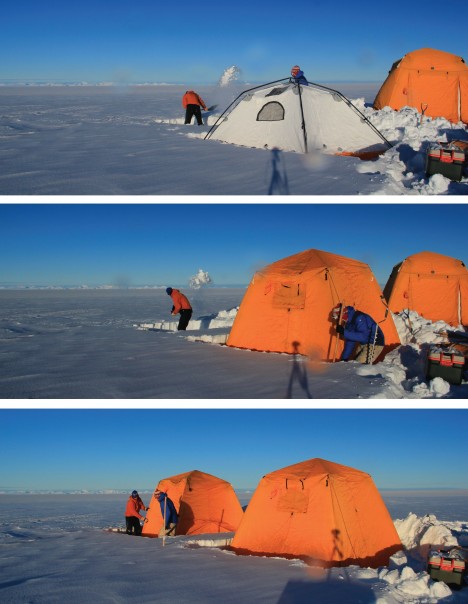
Minutes after the B-212 had left Clem and me on the ice sheet, we were already shoveling the fresh snow to install our cooking and sleeping tents before dark. This was no time for play, this was no time for fun, there was work to be done.
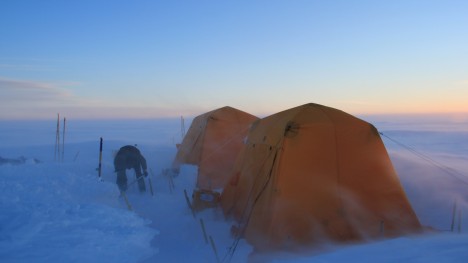
Shoveling, a typical activity at camp. Luckily this year we did not have to shovel too much to maintain our tents.
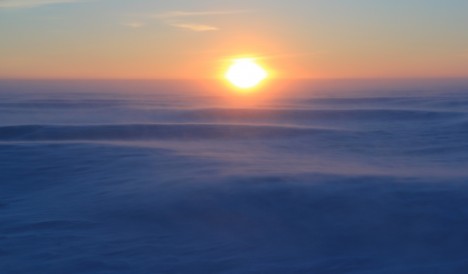
With the amount of fresh snow and the katabatic winds increasing, snow dunes were forming perpendicular to the direction of the wind — it was like being at sea! Half a day later, sastrugis developed along the wind direction and snow became hard and compact.
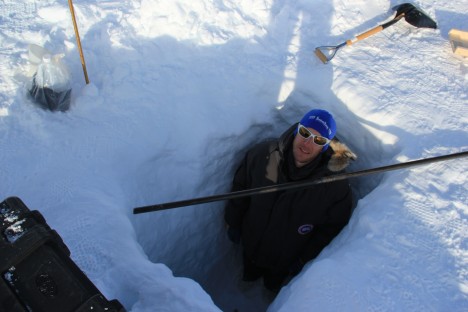
Ludo inside a 2-m-deep pit dug with the hope to repair a broken pilot pipe for installing a pressure transducer in the aquifer.
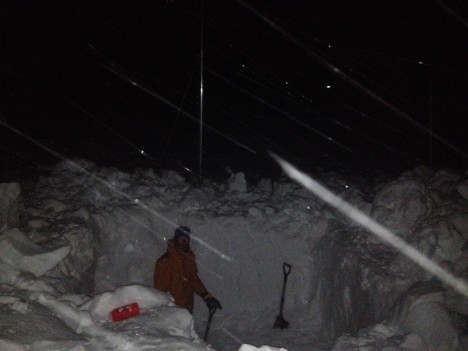
Ludo, inside a larger 2-meter-deep pit dug after dinner with easterly winds increasing as another coastal storm was coming bringing more snow. Our rationale was that the sooner we dug, the less snow we’d have to remove.
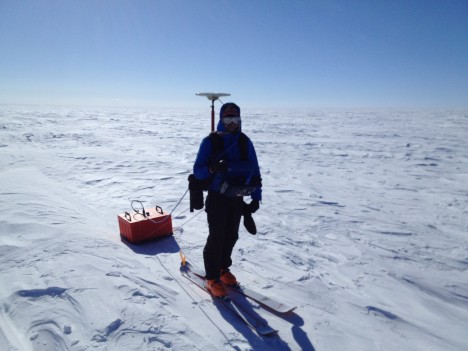
Two hours before being pulled out from the field, Clem was dragging the 200 MHz radar, and carrying a GPS unit.
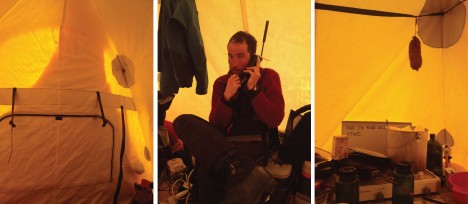
(Left) Snow accumulated on our tent entrance overnight. We monitored it carefully every half hours from 2 am to the late evening. We took care of it a couple of times! (Middle) Clem calling the weather service to find out what wind speeds would hit us during the night. (Right) Our last saucisson, hanging over the snow/water pot.
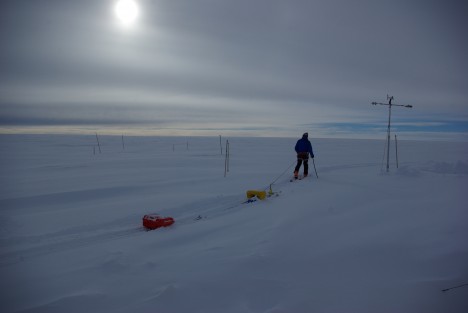
Clem uses an evening break in the weather to drag a low-frequency radar in the fresh snow deposited in the previous hours.
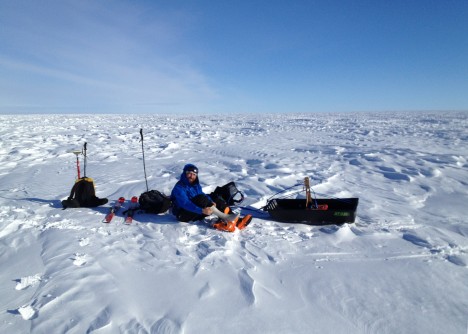
Weather was clement enough with Clément to allow him for a pit stop during our half-marathon radar day around camp.
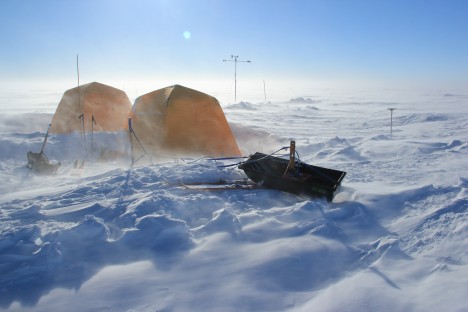
A new day, different weather, and another attempt to collect more radar data. Since we aimed at collecting surface-based radar data, not airborne radar data, we quickly had to stop because the wind would make the radar system take off with every other gust.
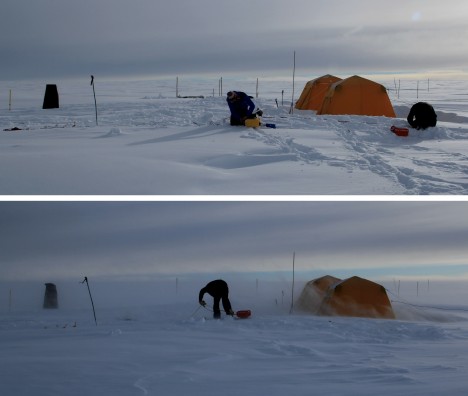
Pictures taken just one hour apart. In the top one, we were setting up a radar system. In the bottom one, we were actively wrapping it due to sudden katabatic winds that picked up in less than 10 minutes.
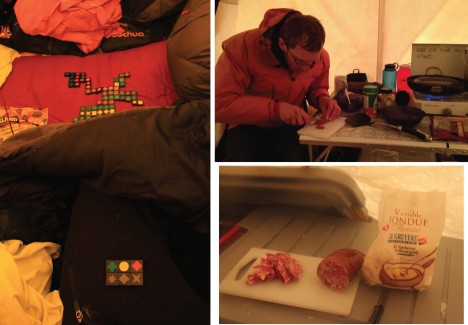
Indoor activities while the winds prevented us from working. (Left) Playing domino with mitts in a shaking tent, unforgettable times! (Right) Good food to keep us happy. Merci maman for thinking about us before leaving home.
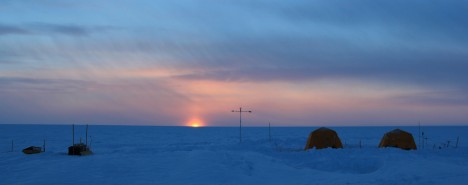
Our flight back had already been canceled twice. It turned out that this was our last evening at camp. We had a total of two pretty sunsets: one on the first day and the second 12 days later, on our last evening.
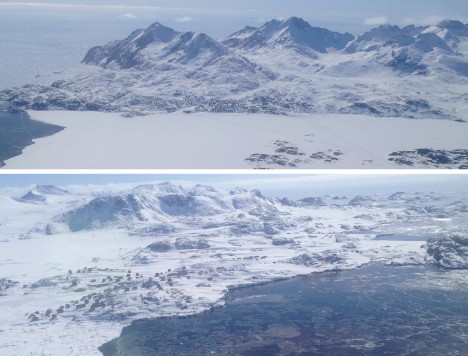
Forty minutes after leaving our camp, we see signs of life: a view of Tasiilaq (top) and Kulusuk (bottom), minutes before landing.
We’d like to finish with this quote from the French explorer Jean-Baptiste Charcot, who led the second French expedition in Antarctica around 1910:
“D’où vient l’étrange attirance de ces régions polaires, si puissantes, si tenaces, qu’après en être revenu ou oublie les fatigues, morales et physiques, pour ne songer qu’à retourner vers elles? D’où vient le charme inouï de ces contrées pourtant désertes et terrifiantes?” (“Where does the strange attraction of the polar regions come from, so powerful, so stubborn, that after returning from them we forget the fatigue, moral and physical, only to think of returning there? Where does the incredible charm of these lands come from, however deserted and terrifying?”) Jean-Baptiste Charcot, Le Pourquoi Pas?
By Clément Miège
Hi there! Today I will give you some background on the radar measurements we collected in southeast Greenland. The radar we deployed is sensitive to snow density changes and to wet snow. The main goal of the radar measurements was to provide information about the spatial variations of the top of the aquifer (a water layer trapped within firn, or old snow).
The radar we used is made by GSSI, a company specialized into geophysical measurements, and it has a center frequency of 400 MHz. In snow and firn, the electromagnetic waves sent by this ground-penetrating radar can image approximately the first 50 meters of a dry snowpack. The layers that we observe in radar measurements show the snowpack stratigraphy (density changes). If there is water within the snow and firn, we observe a really strong radar echo in the radar profile. Then, by dragging the radar around, we are able to see how this water layer evolves spatially.
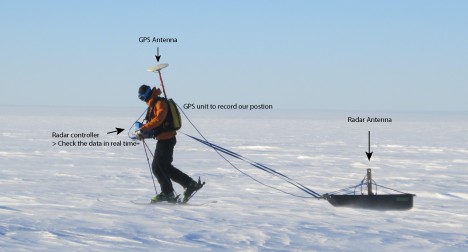
Here is the radar system in action, with Ludo pulling the sled. It can be a pretty tiring job with the wind and the cold. The balaclava was an absolute must to protect your face from the freezing temperatures.
Mostly to lighten our helicopter loads, but also to exercise a bit, we decided to pull the radar sled with skis. But it ended up not being an easy job at times: some of our field days were really windy and cold, so we needed to be warmly dressed and have our face well-protected. In addition, we carried a backpack with the GPS unit and a battery – they became pretty heavy after an hour of pulling the radar. Ludo and I set up the rule of not doing more than 2 hours of survey at a time, which corresponded to about 5 km total.
Once on the ice sheet, as soon as the helicopter took off, we turned on the radar. Indeed, we wanted to make sure that we had been dropped over water and then find the best location for our drilling site. By looking at the radar profile, we identified the water layer (great!) and we converted its depth from electromagnetic wave two way travel time to meters. We observed that over a 2-km transect, the top of the aquifer varied up to 10 meters. By knowing this variation, we were able to pick the site location at a depth that fitted our science needs.
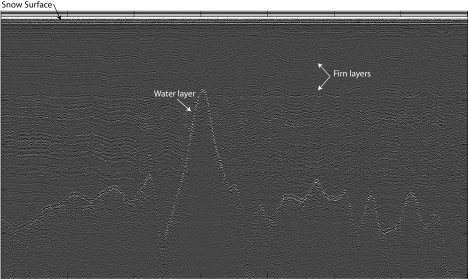
An example of the radar profile observed: the bright reflector represents the top of the water layer. Other internal reflections can be seen — they are linked to previous summer layers, which are denser.
The advantage of doing this preliminary radar survey is that we then knew before drilling at which depth the drill would encounter water and penetrate into the aquifer. And the good thing was that the radar picked the right water depth in both drilling sites! The radar ended up being a really good tool to extend spatially the localized information obtained by the firn cores.
For the radar survey, we were doing some elevation transects, to see how the water layer changed with the local topography, and some grids and bowties to extent spatially the core site stratigraphy. We stayed within a radius of 2 km from our camp.
Overall, doing the radar surveys was a great experience. It’s incredible to think that we were skiing with liquid water right below us, while surface temperatures averaging -15C.
Finally, concerning the radar setup, we have already some improvements in mind for the next time. For example, the GPS unit and its antenna need to be in the sled, maybe mounting the GPS antenna on a corner of the radar sled, trying to keep the all setup stable. That will allow us to drag the radar longer. We will work on that for our next radar adventure!
By Michelle Koutnik
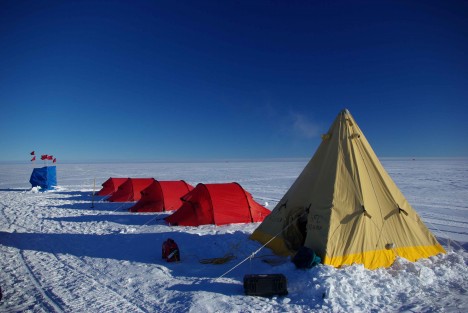
Each of our six different camping sites consisted of one cook tent, four sleeping tents, and a bathroom area (more on that later). The cook tent was a “Scott” tent, which is an enduring style and named for the polar explorer Robert Scott. It was a tight space for five people but we were able to crawl in and then sit around together with one person managing the two-burner propane stove in the corner. The Scott style tent was much sturdier than our mountain-style sleeping tents, but it was also more time consuming to put up and heavier to transport. Since we were moving nearly every other day, we wanted to keep our camp as simple and as light as possible. The Scott tent was a necessary addition for cooking, but also as a reliable shelter in the two strong storms we experienced during the traverse.
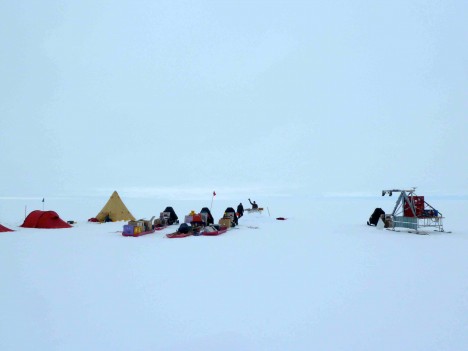
It took a few hours to set up camp, and a similar amount of time to break it down and repack the gear on the sleds. Randy, Jessica, and I were responsible for breaking down most of the camp and for setting up some of the camp on our own while Clement and Ludo collected radar data on traverse days. Once camp was set up at a new site, we could start melting snow for water and start cooking dinner.
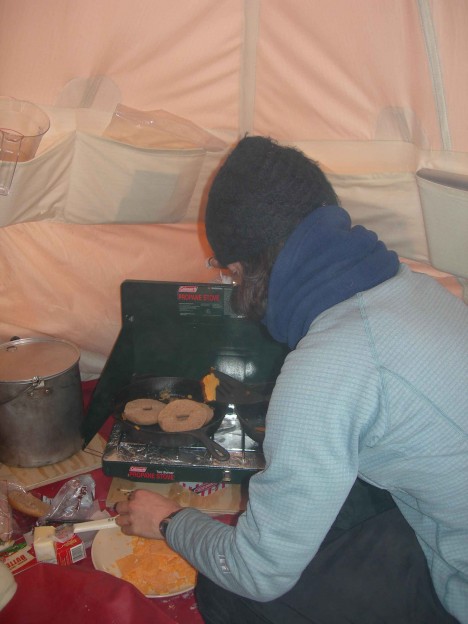
On a traverse day, our camp life included the take down and setup of camp, plus collecting radar data. On an ice-coring day, our camp life included digging and sampling the snow pit, drilling the ice core, and eating a hot lunch. We ate well out there! Our standard meal plan included tortellini with pesto, spaghetti with meatballs, sausage with rice and vegetables, and burritos. Sausages were popular and made their way into many meals. Special nights featured hamburgers with tater tots, and on Christmas we cooked scallops with rice and vegetables. Hot lunch on ice-coring days featured cheesy bagels fried with butter in our cast-iron pan. Since all the cheese and bread was always frozen, it required frying it all together before we could eat it – but it tasted great this way! Stormy-day food was simplified but did afford us the time to enjoy pancakes (two storms, two pancake breakfasts).
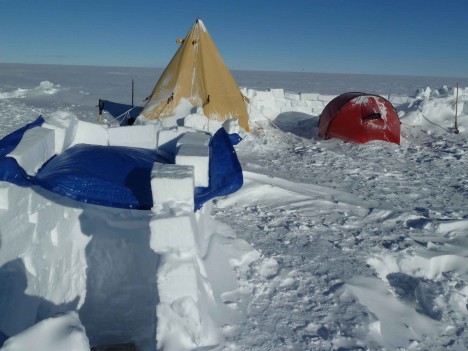
The storms also affected our standard bathroom situation – usually a snow pit and tarp configuration. Ludo took the high winds and blowing snow as a challenge and created a snow-brick bathroom, which we tried our hardest to maintain from drifts!
Maintaining camp and completing the science goals was a big job but we enjoyed being out on the ice sheet. For example, Christmas was a wonderful day to share together because a big storm started to clear, and we had lovely gifts to exchange, two small Christmas trees, and a very nice meal. Overall, the camp life was comfortable and enjoyable and with such a hard-working team, we were efficient at all the tasks necessary to make the camp run and be successful with the science.
